Industrial Properties
2000 Centimeter Circle Austin, TX 78758
2000 Centimeter Circle Austin, TX 78758

Details & Description
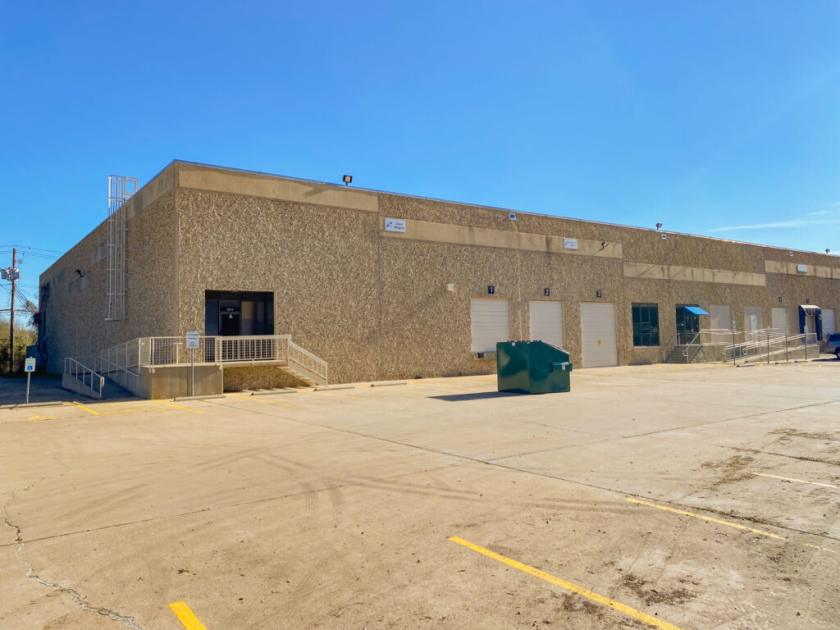
Property Highlights
- • Less than 15% Office
- • 18′ – 24’ Clear Height
- • Front Loading
- • 8 Dock High Doors
- • 5 Grade Level Doors
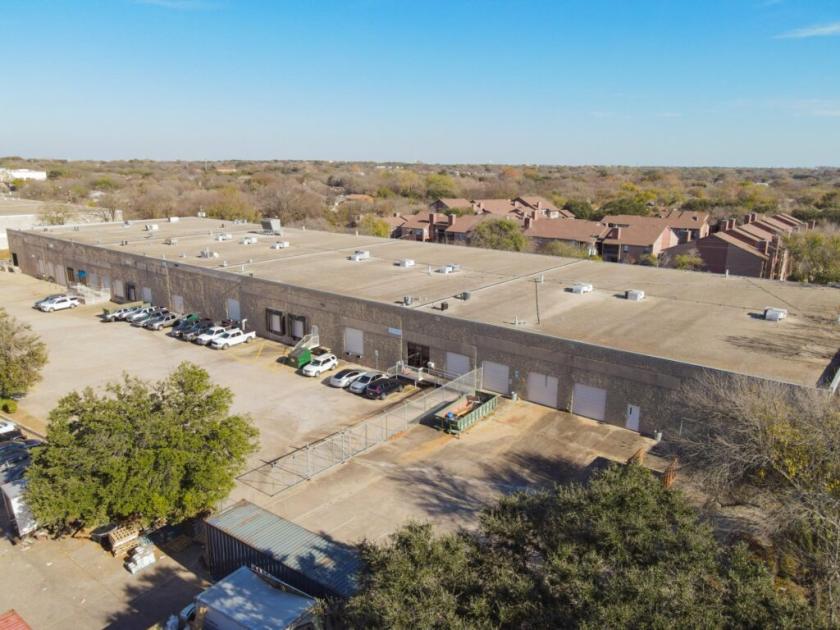
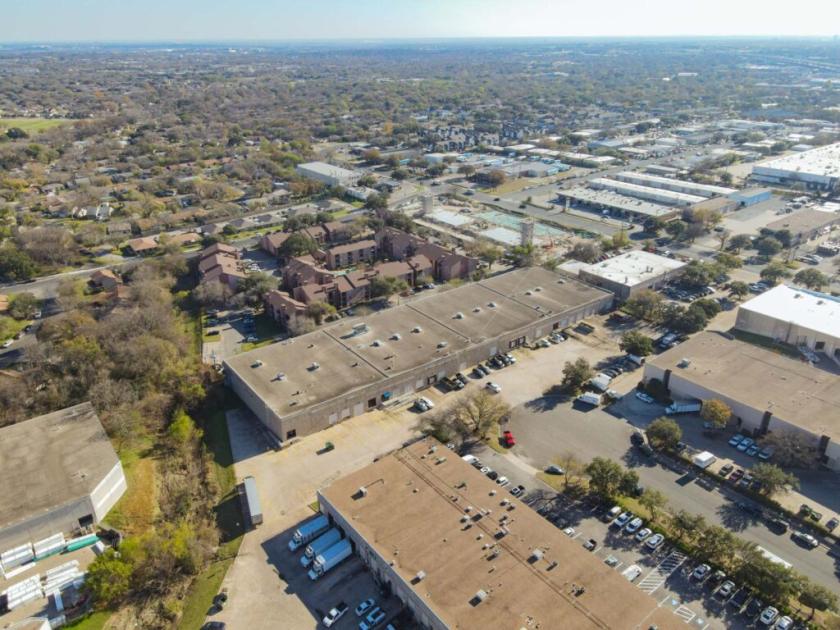
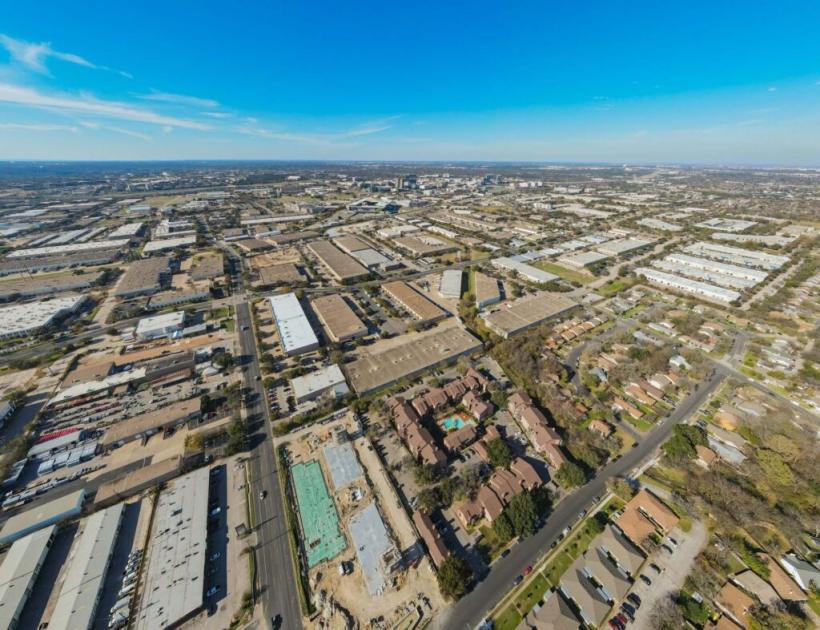
Additional Photos


Listing Agents

Davis Bass
O: 512-538-1030
bass@hpitx.com
O: 512-538-1030
bass@hpitx.com

Brooks Benkendorfer
M: 512-848-2582
brooksb@hpitx.com
M: 512-848-2582
brooksb@hpitx.com
While we strive to provide the most accurate information, all listing information, and demographic data, is provided by third-parties. As such, MyEListing will not be responsible for the accuracy of the information. It is strongly recommended that you verify all information with the listing agent, and any relevant agencies, prior to making any decisions.