Industrial Properties
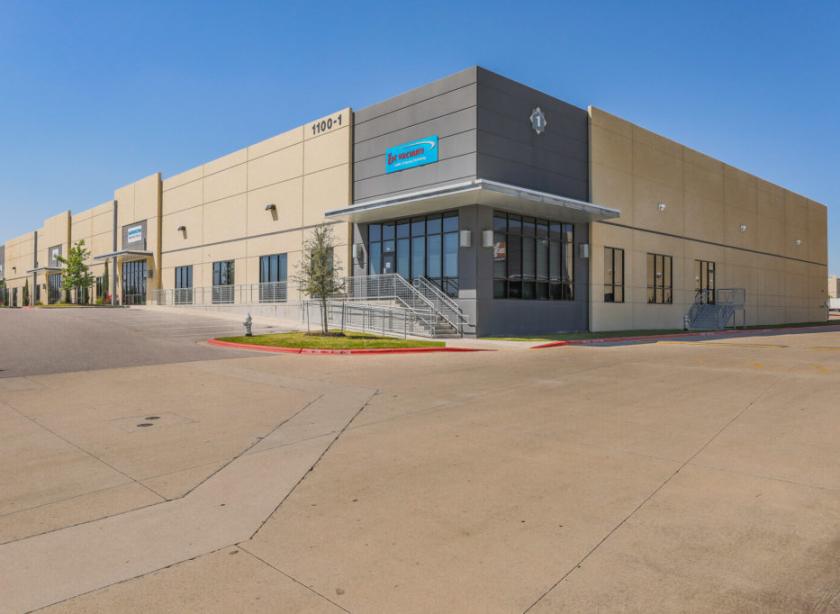
1100 East Howard Lane Austin, TX 78753
1100 East Howard Lane Austin, TX 78753
Details & Description
Property Highlights
- • Rear Loading
- • 11 Dock High Doors
- • 28’ Clear Height
- • ESFR Sprinkler
- • Large Truck Court
- • Triple Freeport
Listing Agents

Davis Bass
O: 512-538-1030
bass@hpitx.com
O: 512-538-1030
bass@hpitx.com

Brooks Benkendorfer
M: 512-848-2582
brooksb@hpitx.com
M: 512-848-2582
brooksb@hpitx.com
While we strive to provide the most accurate information, all listing information, and demographic data, is provided by third-parties. As such, MyEListing will not be responsible for the accuracy of the information. It is strongly recommended that you verify all information with the listing agent, and any relevant agencies, prior to making any decisions.


