Retail Space
221 West Seminary Drive Fort Worth, TX 76115
221 West Seminary Drive Fort Worth, TX 76115

Details & Description
Property Highlights
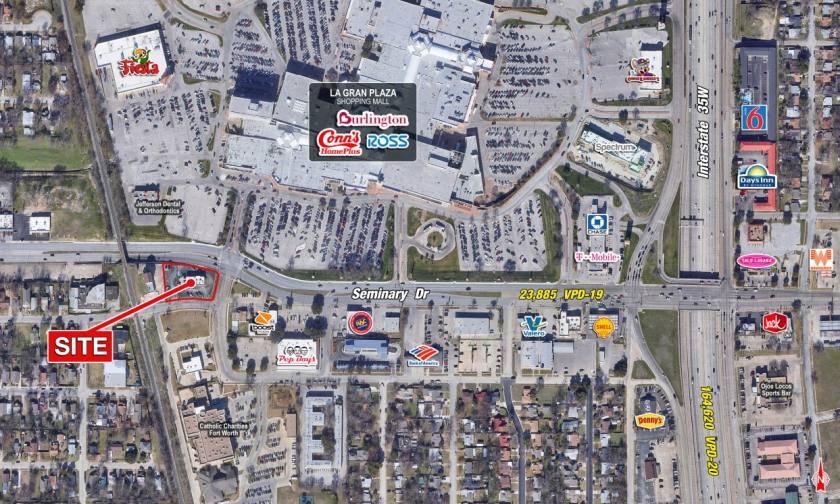
• Traffic Counts: Interstate 35W 164,620 VPD-20
• Traffic Counts: Seminary Dr 23,885 VPD-19
Additional Photos


Listing Agents

Daniel Frid
O: 214-960-4545
M: 214-501-5108
dfrid@shopcompanies.com
O: 214-960-4545
M: 214-501-5108
dfrid@shopcompanies.com

Jake Sherrington
O: 214-960-4545
M: 214-960-4623
jake@shopcompanies.com
O: 214-960-4545
M: 214-960-4623
jake@shopcompanies.com
While we strive to provide the most accurate information, all listing information, and demographic data, is provided by third-parties. As such, MyEListing will not be responsible for the accuracy of the information. It is strongly recommended that you verify all information with the listing agent, and any relevant agencies, prior to making any decisions.


