Industrial Properties
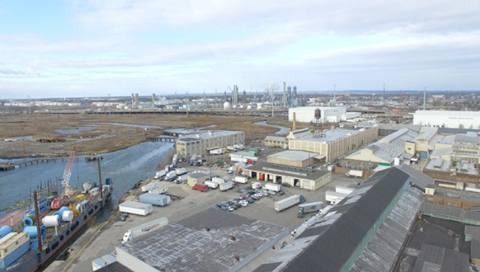
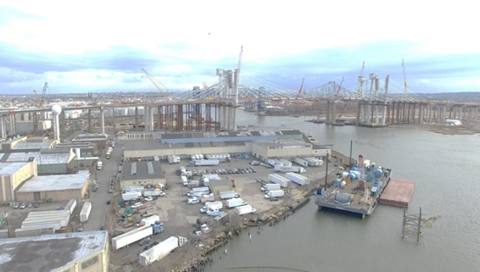
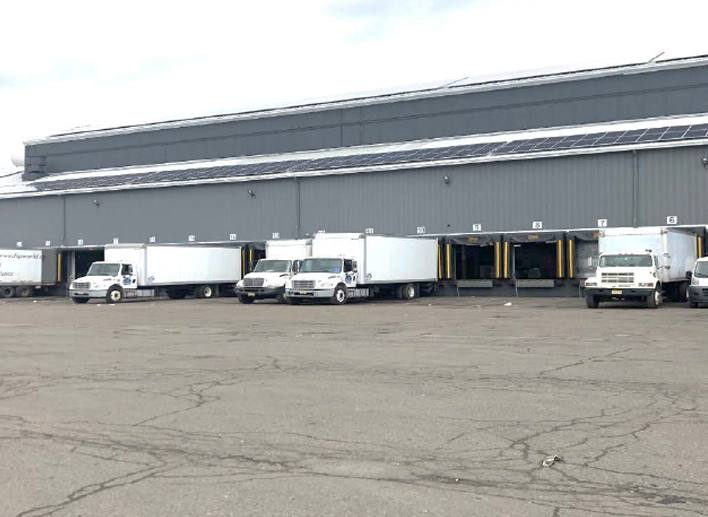
720 South Front Street Elizabeth, NJ 07202
720 South Front Street Elizabeth, NJ 07202
Details & Description
Property Highlights
• ±14,200 SF Industrial Opportunity
• ±14,200 SF Industrial Opportunity
Listing Agents

Jason M. Crimmins
O: 973-379-6644
M: 973-568-6611
jmcrimmins@blauberg.com
O: 973-379-6644
M: 973-568-6611
jmcrimmins@blauberg.com
While we strive to provide the most accurate information, all listing information, and demographic data, is provided by third-parties. As such, MyEListing will not be responsible for the accuracy of the information. It is strongly recommended that you verify all information with the listing agent, and any relevant agencies, prior to making any decisions.