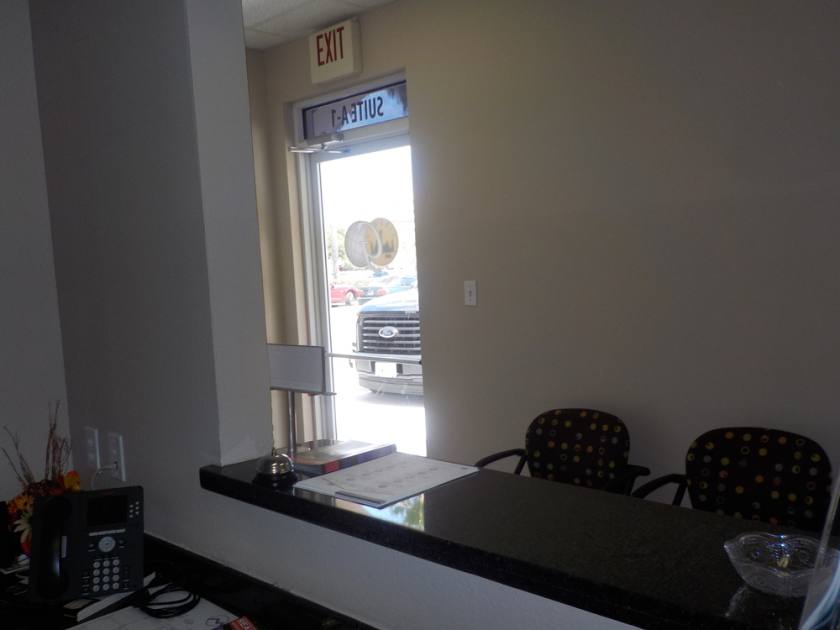
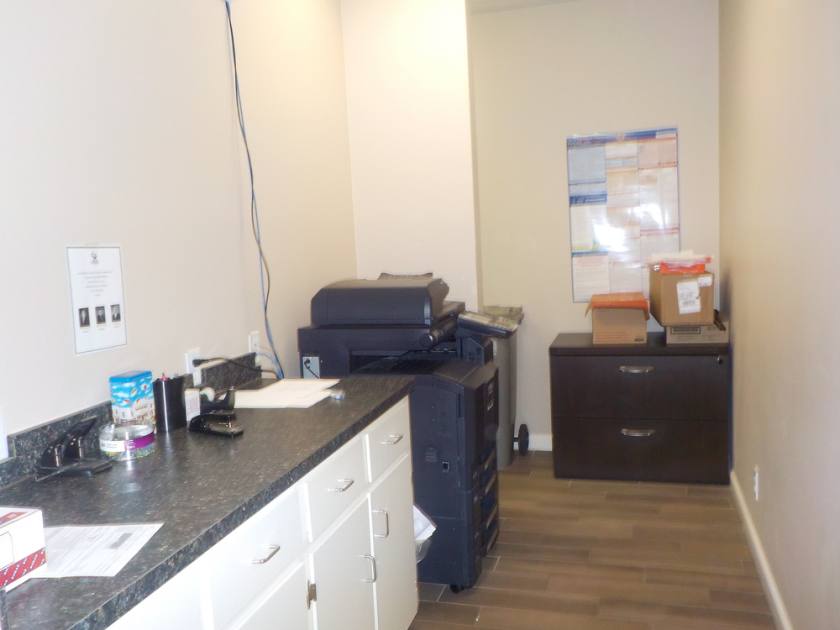
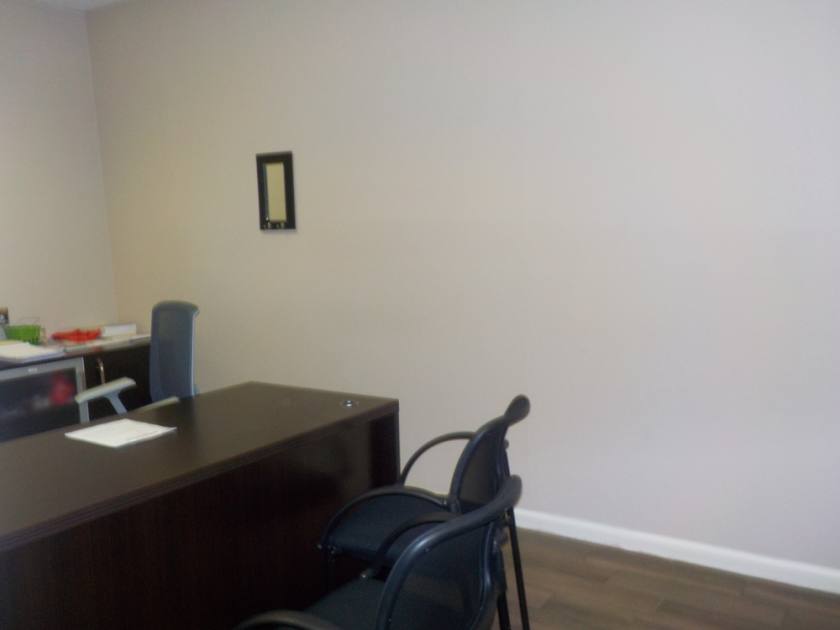
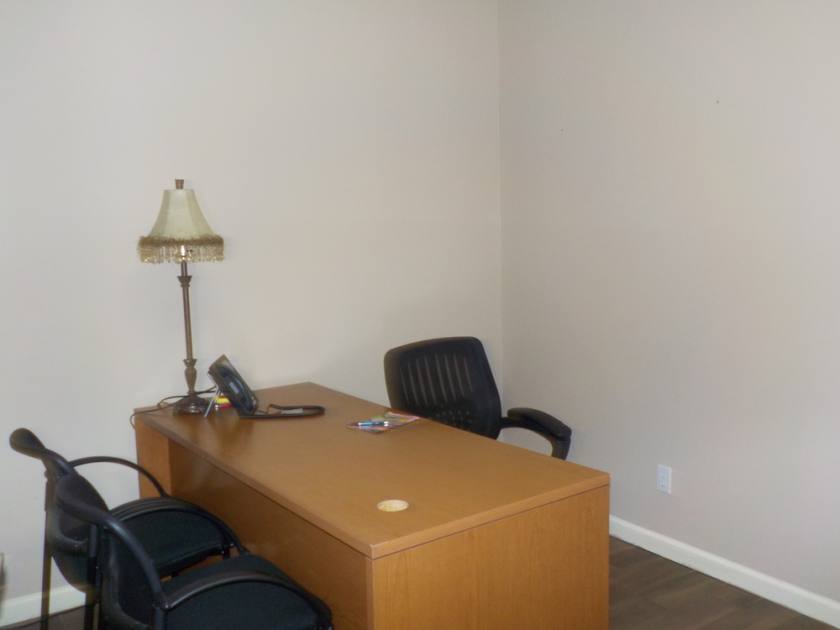
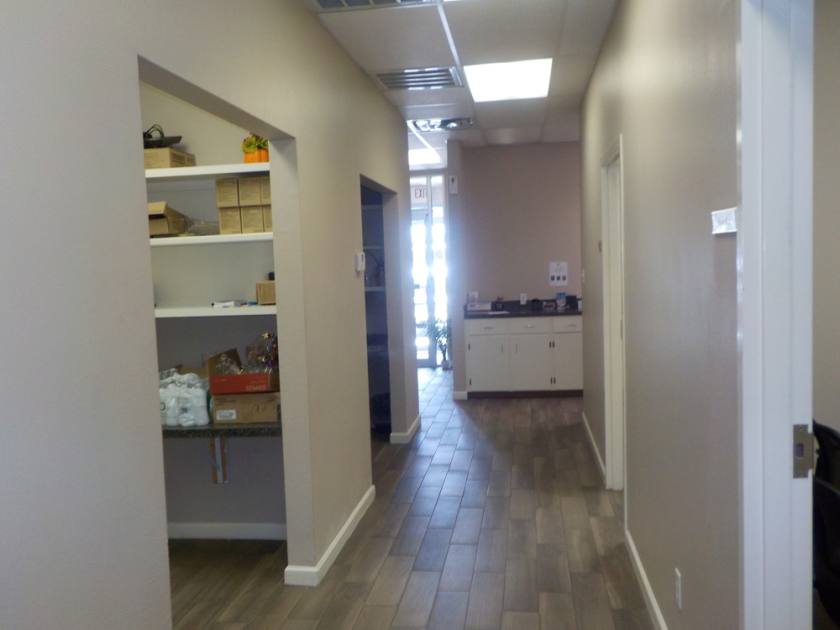
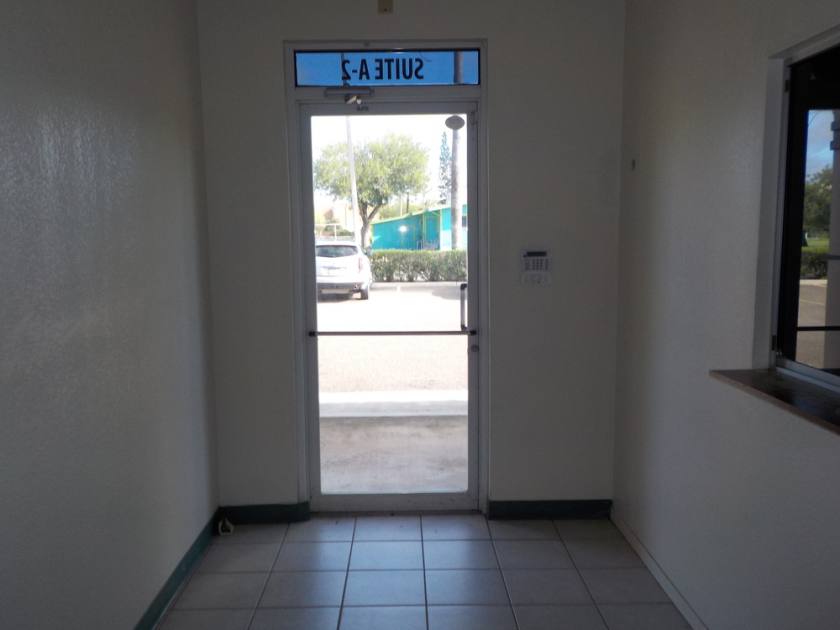
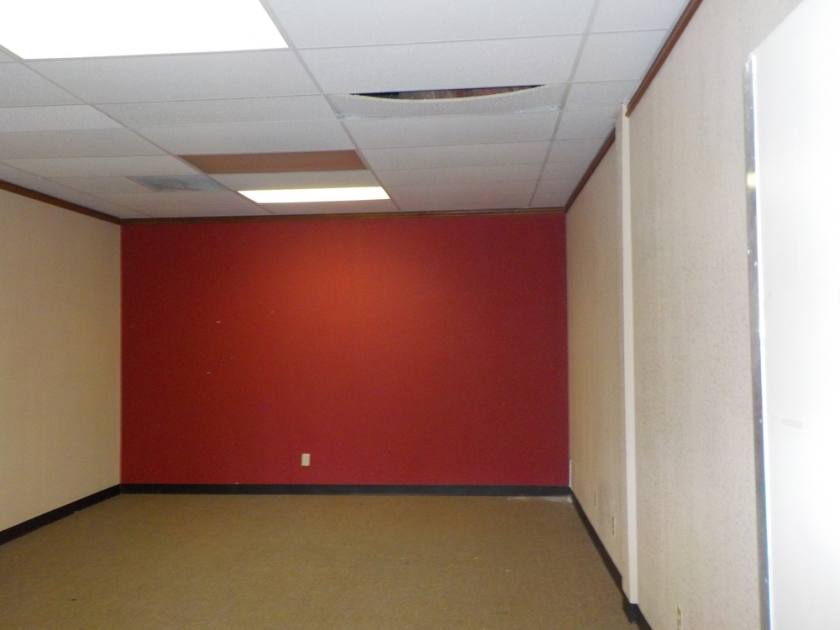
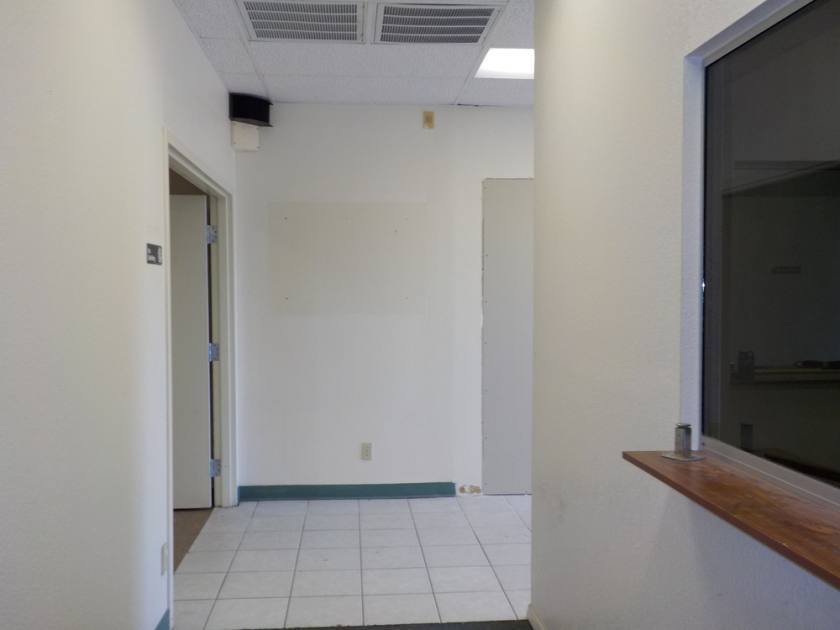
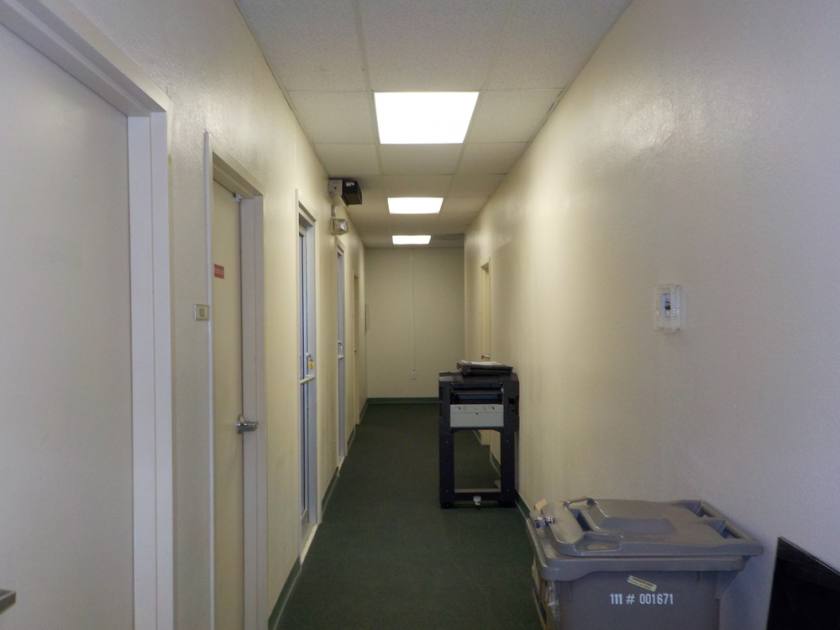
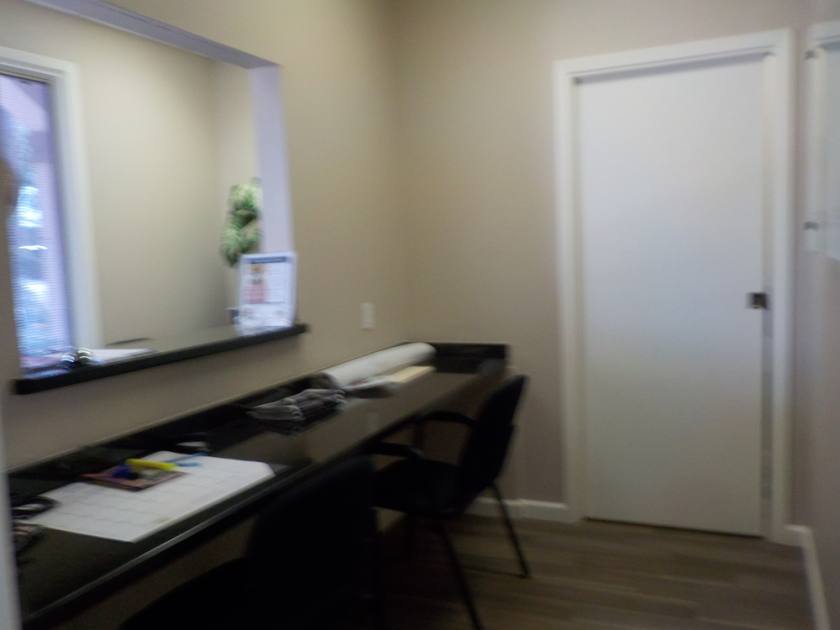
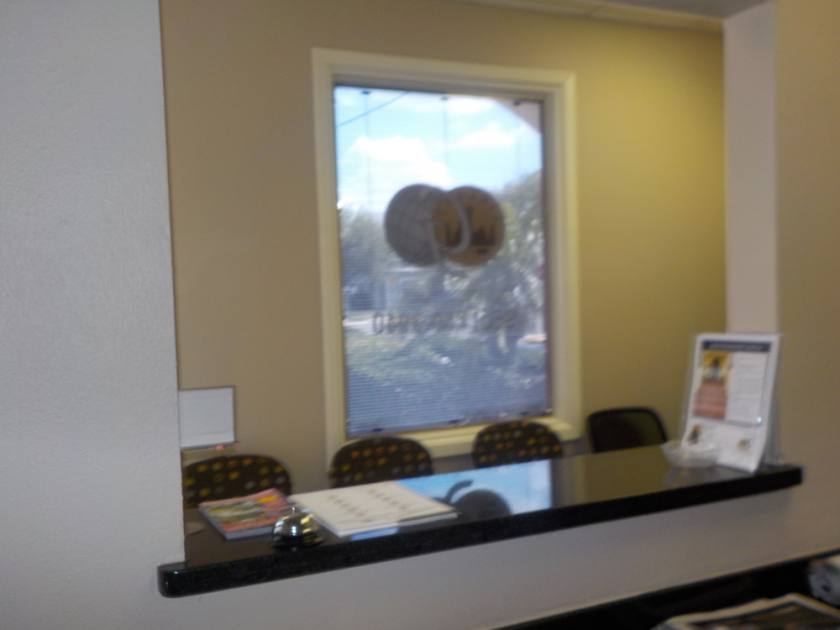
Office Space
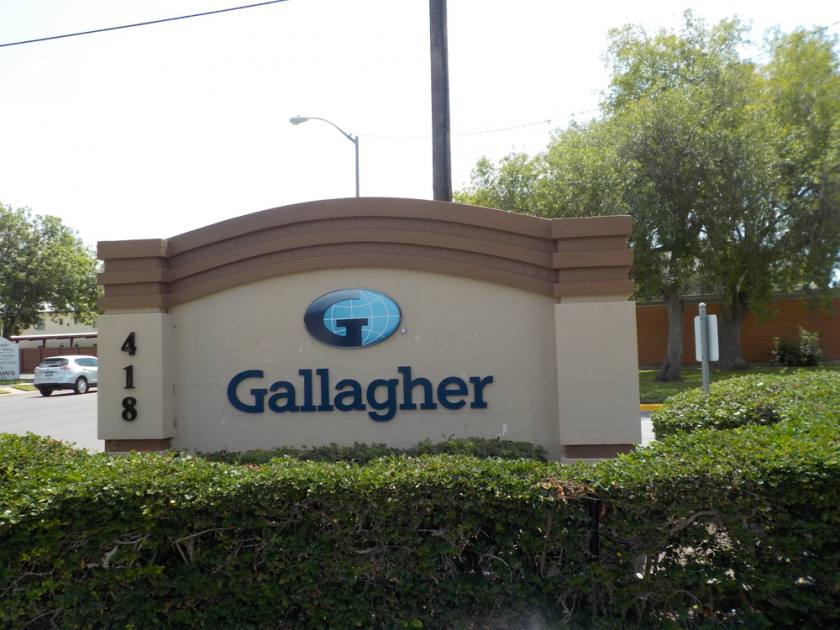
418 East Tyler Avenue Harlingen, TX 78550
418 East Tyler Avenue Harlingen, TX 78550

Details & Description
Property Highlights
- • Professional Office
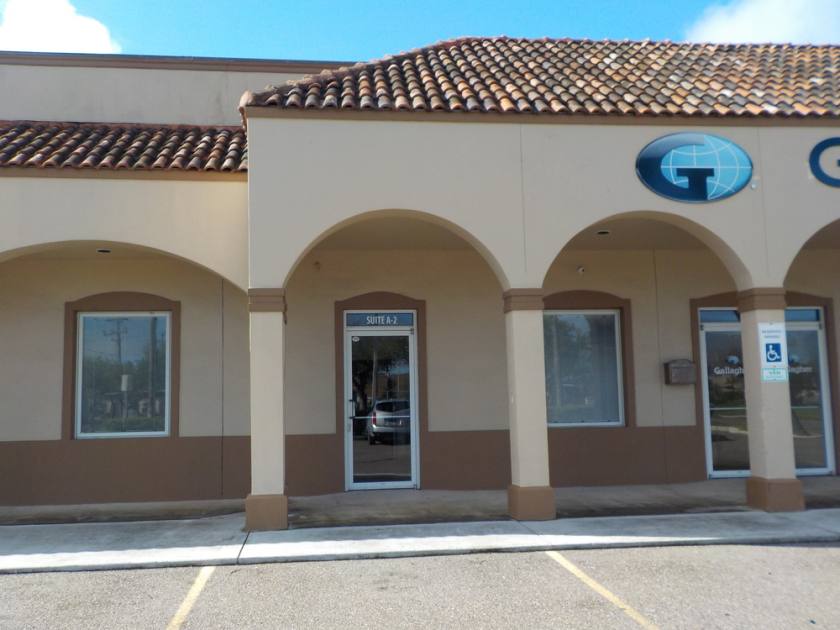
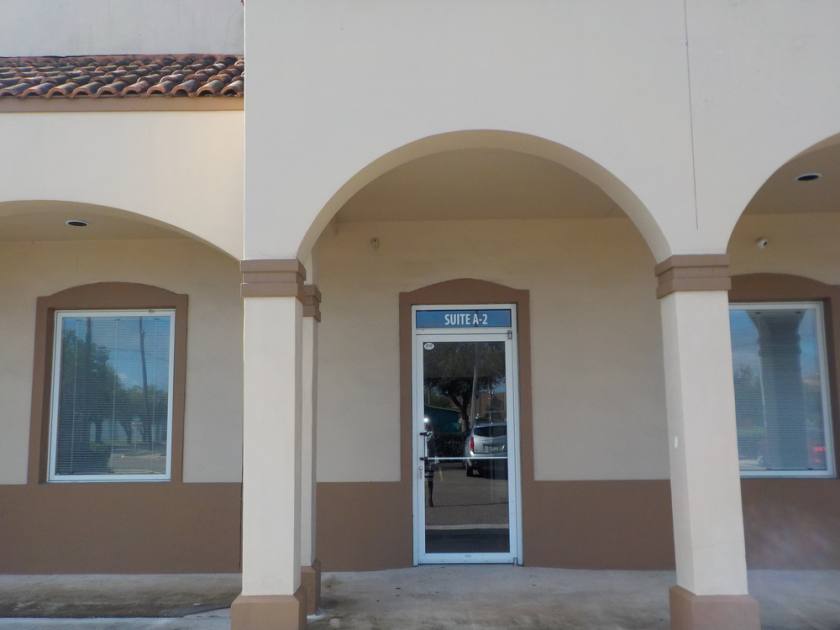
- • Covered Parking
- • High-Traffic Corridor
- • Drive Up Parking
- • Easy Access
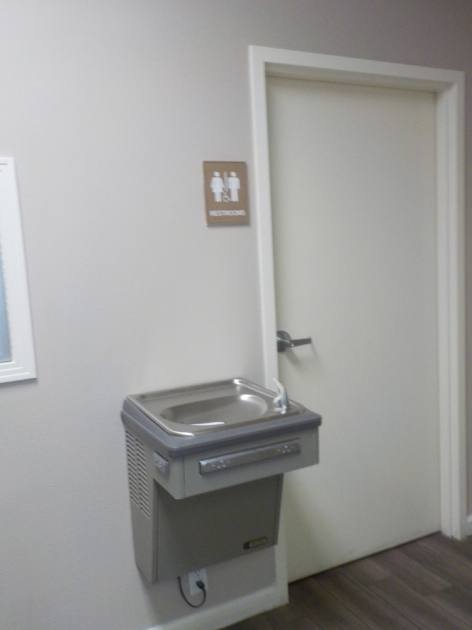
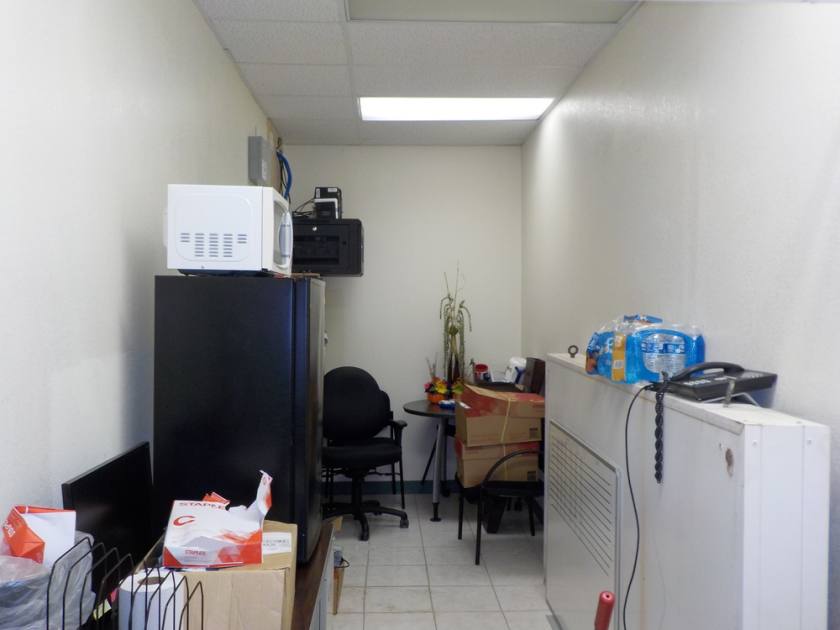
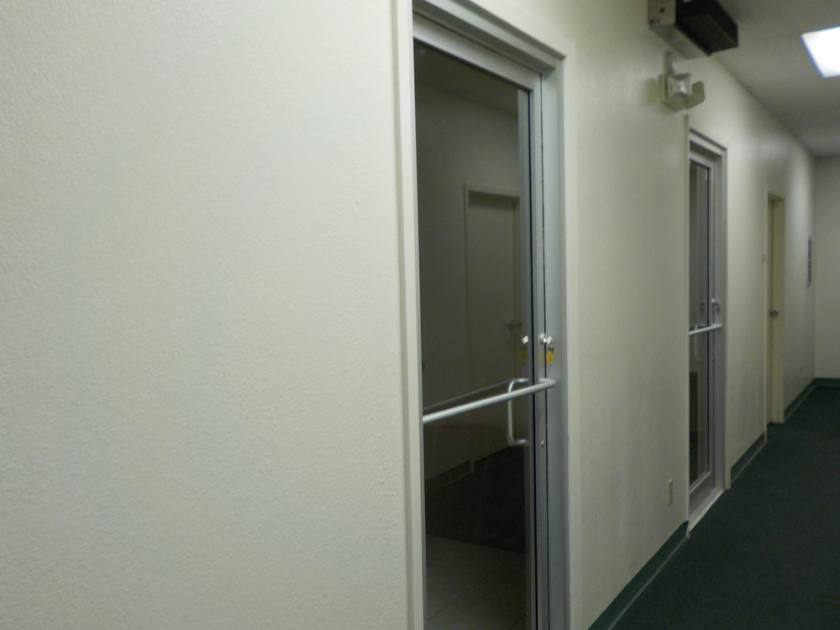
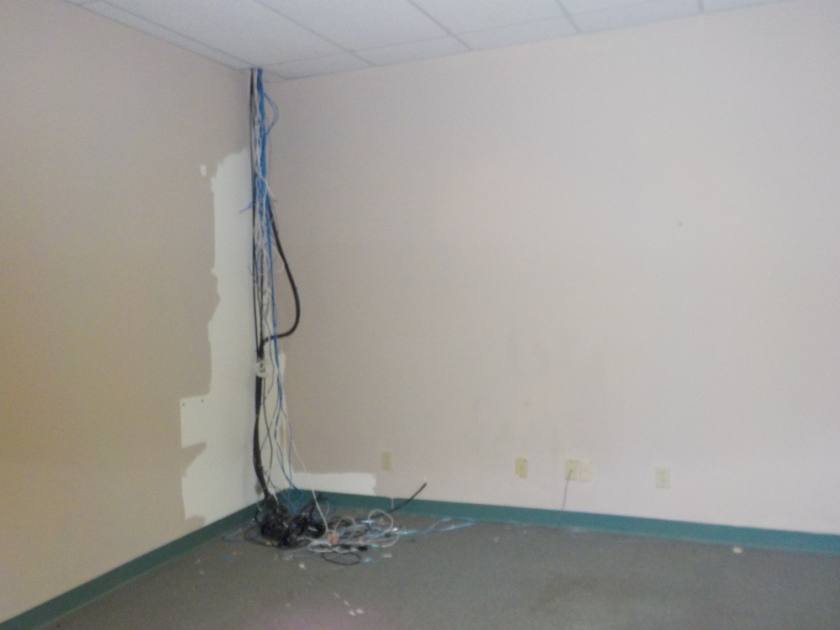
Additional Photos

Listing Agents

Cindy Hopkins
O: 956-778-3255
M: 956-778-3255
chopkins@ccim.net
O: 956-778-3255
M: 956-778-3255
chopkins@ccim.net
While we strive to provide the most accurate information, all listing information, and demographic data, is provided by third-parties. As such, MyEListing will not be responsible for the accuracy of the information. It is strongly recommended that you verify all information with the listing agent, and any relevant agencies, prior to making any decisions.