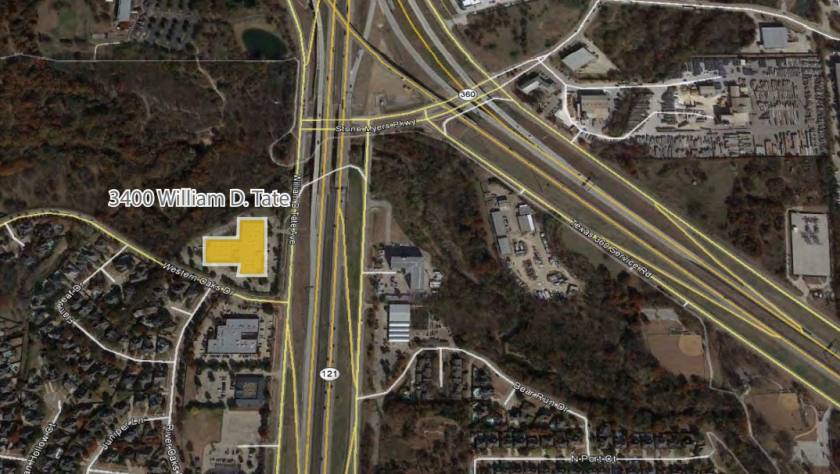
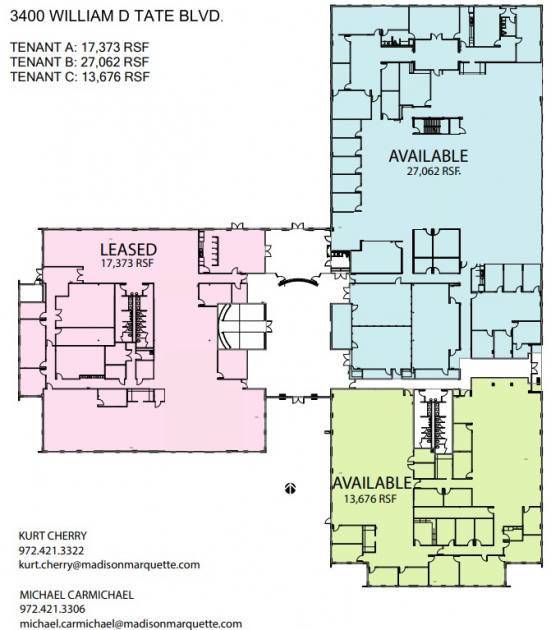
1-Mile | 3-Miles | 5-Miles | ||
---|---|---|---|---|
Total Population | 8,943 | 59,812 | 174,360 | |
Population Median Age | 40 | 39 | 39 | |
Population by Age | 0-9 Yrs | 1102 (12%) | 7361 (12%) | 21063 (12%) |
10-19 Yrs | 1189 (13%) | 7462 (12%) | 22876 (13%) | |
20-29 Yrs | 863 (9%) | 7019 (11%) | 20748 (11%) | |
30-39 Yrs | 1209 (13%) | 7710 (12%) | 23158 (13%) | |
40-49 Yrs | 1000 (11%) | 7828 (13%) | 23873 (13%) | |
50-59 Yrs | 1530 (17%) | 9868 (16%) | 26445 (15%) | |
60-69 Yrs | 1291 (14%) | 7435 (12%) | 20926 (12%) | |
70+ Yrs | 759 (8%) | 5129 (8%) | 15271 (8%) | |
Median HH Income | $108,961 | $110,588 | $92,930 | |
Total Household Income | < 24K | 316 (9%) | 1524 (6%) | 5636 (8%) |
25-49K | 322 (9%) | 2596 (11%) | 10629 (15%) | |
50-74K | 569 (16%) | 3180 (14%) | 11182 (16%) | |
75-99K | 410 (11%) | 2763 (12%) | 8231 (12%) | |
100-199K | 1091 (31%) | 7341 (32%) | 19127 (28%) | |
200K+ | 741 (21%) | 4873 (21%) | 11896 (17%) | |
Highest Education Level | No Diploma | 289 | 2198 | 6984 |
Diploma or GED | 645 | 4898 | 19021 | |
Some College | 963 | 8336 | 25843 | |
Assoc. Degree | 397 | 2774 | 9691 | |
Bachelors Degree | 2598 | 14848 | 38700 | |
Higher Degree | 1291 | 8416 | 20519 | |
Total Housing Units | 3,567 | 23,206 | 69,655 | |
--Owner-Occupied | 2,323 | 15,351 | 40,620 | |
--Renter-Occupied | 1,127 | 6,927 | 26,081 | |
Owner-Occupied Values | < 100K | 37 | 660 | 1450 |
100-199K | 30 | 1303 | 5482 | |
200-299K | 319 | 2624 | 9100 | |
300-399K | 864 | 3576 | 7864 | |
400-499K | 686 | 2815 | 5505 | |
500K+ | 386 | 4373 | 11220 | |
Total Working Age Population | 7,065 | 47,501 | 137,999 | |
In Work Force | 5,164 | 34,242 | 98,560 | |
Not In Work Force | 1,901 | 13,259 | 39,439 | |
Workforce Employed | 4,846 | 32,772 | 94,409 | |
Workforce Unemployed | 318 | 1,468 | 4,116 | |
Civlian Workforce | 5,164 | 34,240 | 98,525 | |
Military Workforce | 0 | 2 | 35 | |
Total Households | 3,449 | 22,278 | 66,701 | |
Family Households | 2,541 | 16,257 | 45,453 | |
Non-Family Households | 909 | 6,021 | 21,247 | |
Married Couple | 2,170 | 13,823 | 36,350 | |
Other Family | 370 | 2,434 | 9,104 | |
Married w/Child | 837 | 5,565 | 14,914 | |
Single Male w/Child | 58 | 436 | 1,402 | |
Single Female w/Child | 133 | 755 | 3,322 |
Population Change Last Two Decades - Plus Projection
2000 | % | 2010 | % | 2020 | % | 2030 | |
---|---|---|---|---|---|---|---|
Texas | 20,851,820 | +21 | 25,145,561 | +18 | 29,677,668 | +18 | 34,894,452 |
Tarrant County | 1,446,219 | +25 | 1,809,034 | +19 | 2,143,755 | +17 | 2,507,170 |
Dallas County | 2,218,899 | +7 | 2,368,139 | +15 | 2,734,111 | +14 | 3,106,298 |
Total Working Age Population:
Total Households:
Total Working Age Population:
Total Households:
Total Working Age Population:
Total Households: