Industrial Properties
3201 North Sylvania Avenue Fort Worth, TX 76111
3201 North Sylvania Avenue Fort Worth, TX 76111
Details & Description
Property Highlights
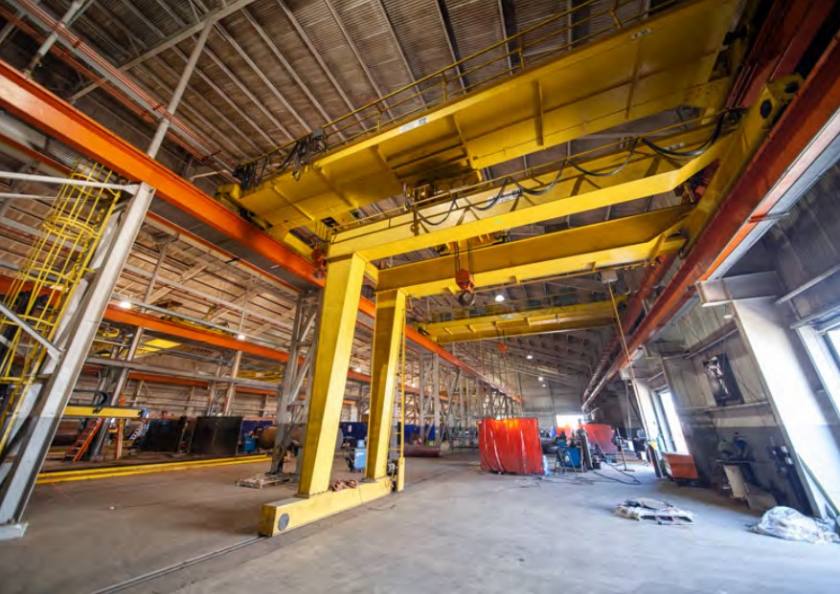
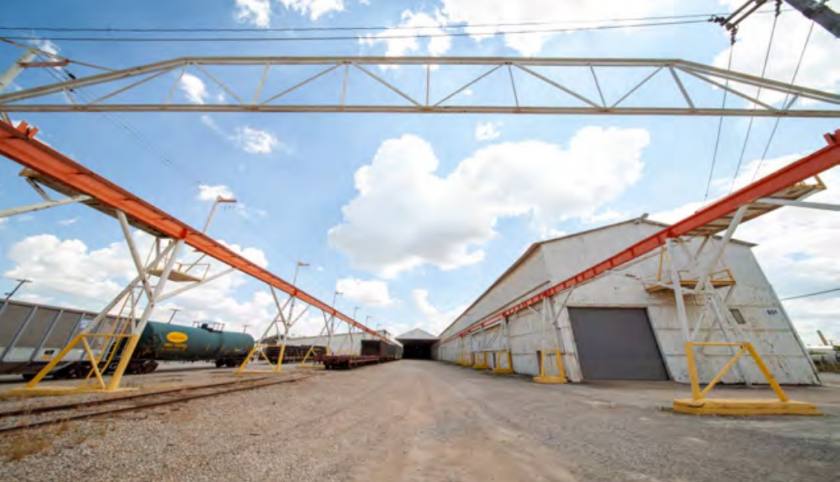
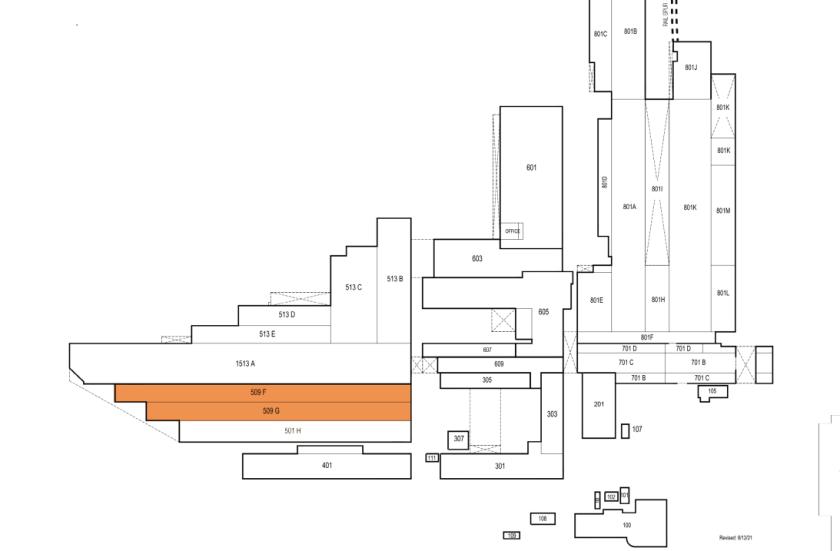
- • Zoned “K” Heavy Industrial
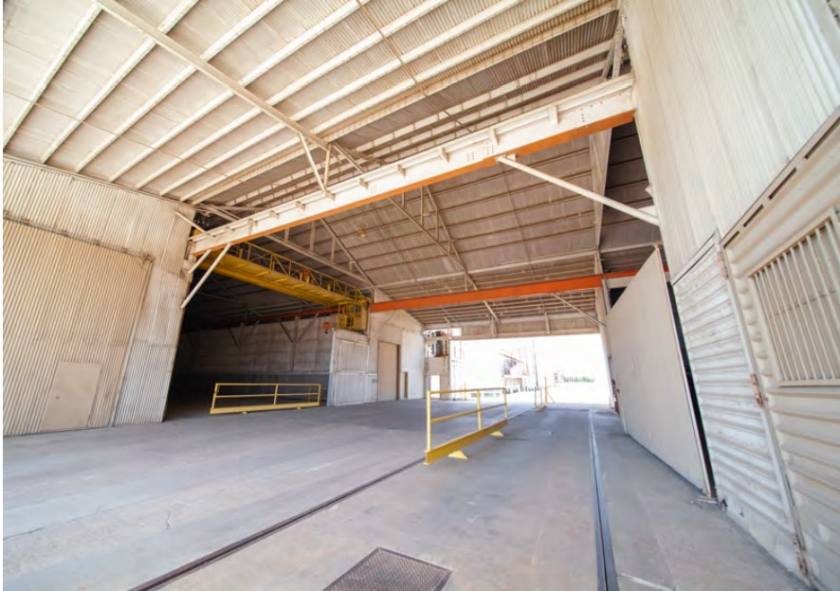
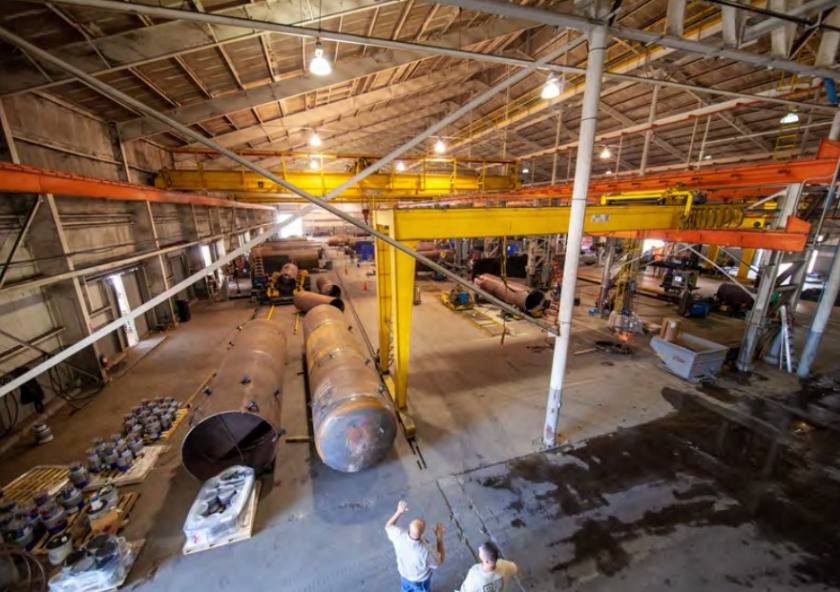
- • Over 550 Tons of Crane Served Space
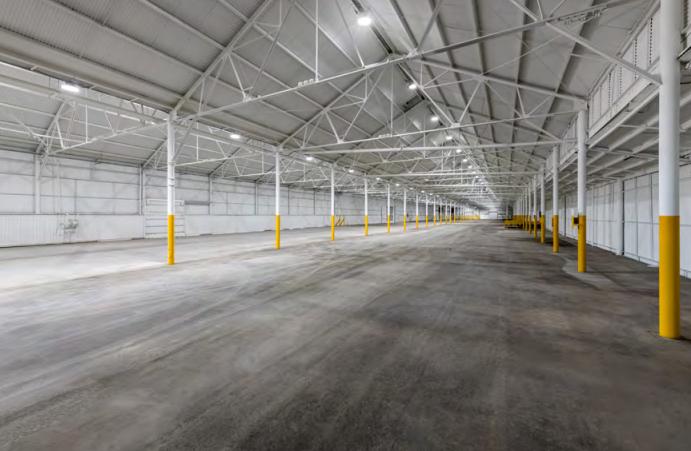
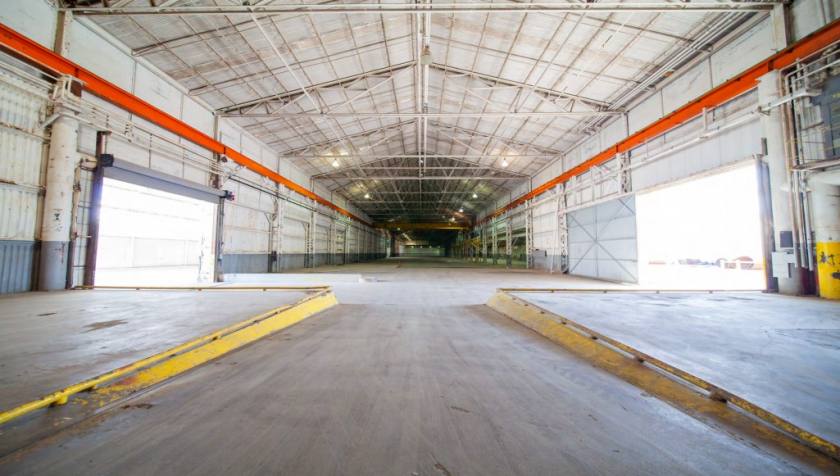
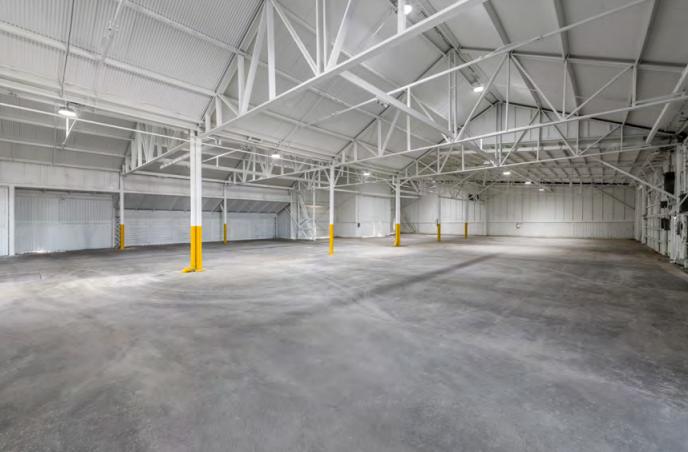
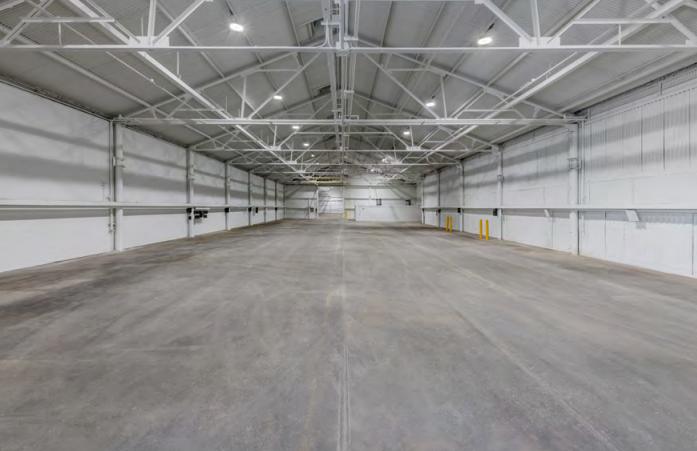
- • Up to 50’ Clear Heights
- • Heavy Power Throughout the Facilities
- • Oversized Grade Level Doors
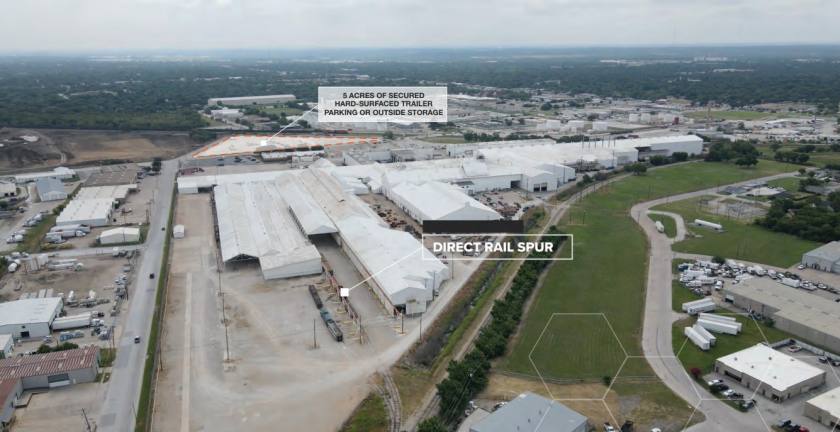
- • Immediate Access to Interstate 35 West
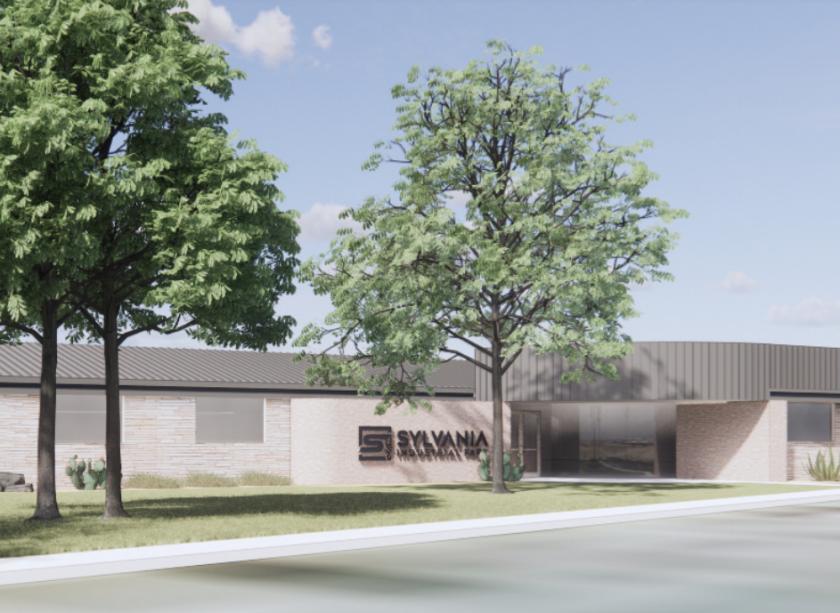
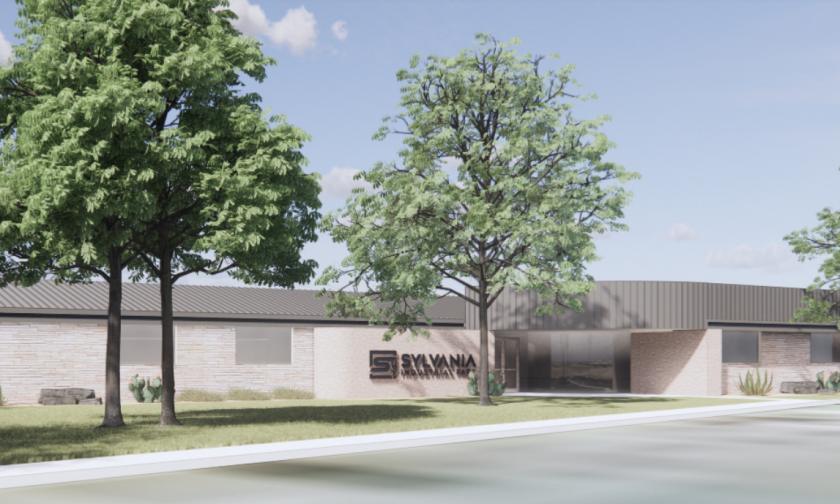
Additional Photos


Listing Agents

Jeffry Jackson
O: 817-872-3910
M: 817-559-1991
jjackson@nairl.com
O: 817-872-3910
M: 817-559-1991
jjackson@nairl.com

Todd Hubbard
NAI Robert Lynn
O: 817-872-3901
M: 817-501-2012
thubbard@nairl.com
NAI Robert Lynn
O: 817-872-3901
M: 817-501-2012
thubbard@nairl.com

Michael Newsome
NAI Robert Lynn
O: 817-872-3903
M: 214-770-5070
mnewsome@nairl.com
NAI Robert Lynn
O: 817-872-3903
M: 214-770-5070
mnewsome@nairl.com
While we strive to provide the most accurate information, all listing information, and demographic data, is provided by third-parties. As such, MyEListing will not be responsible for the accuracy of the information. It is strongly recommended that you verify all information with the listing agent, and any relevant agencies, prior to making any decisions.