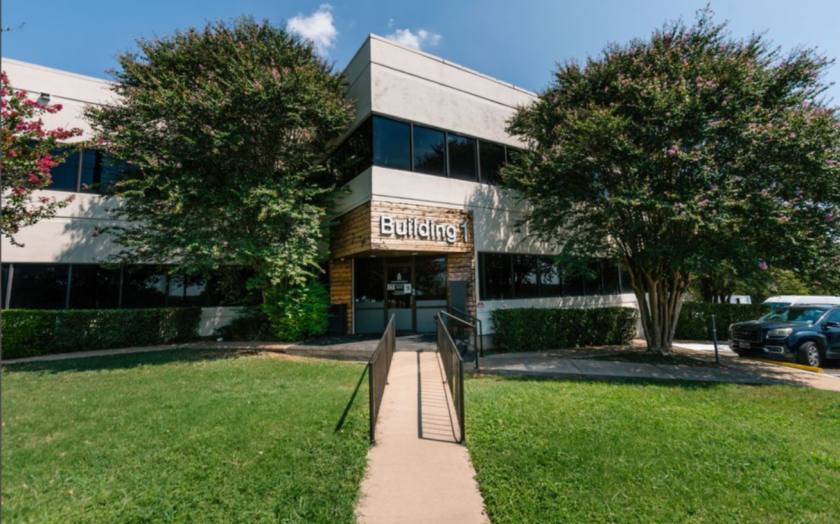
Office Space
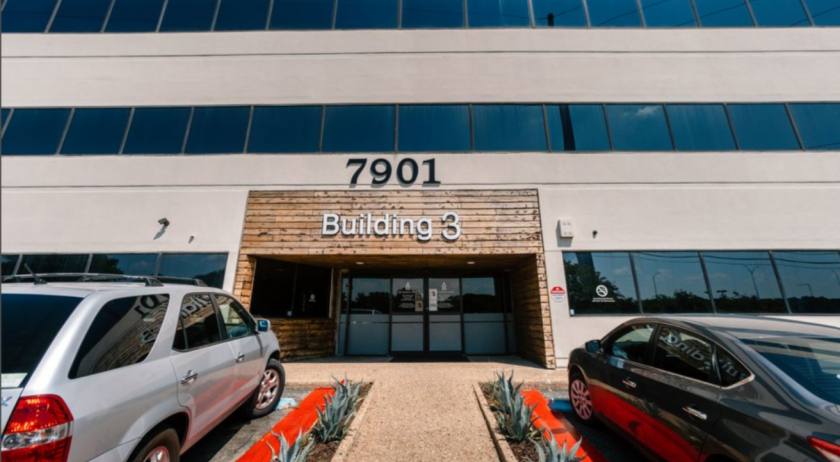
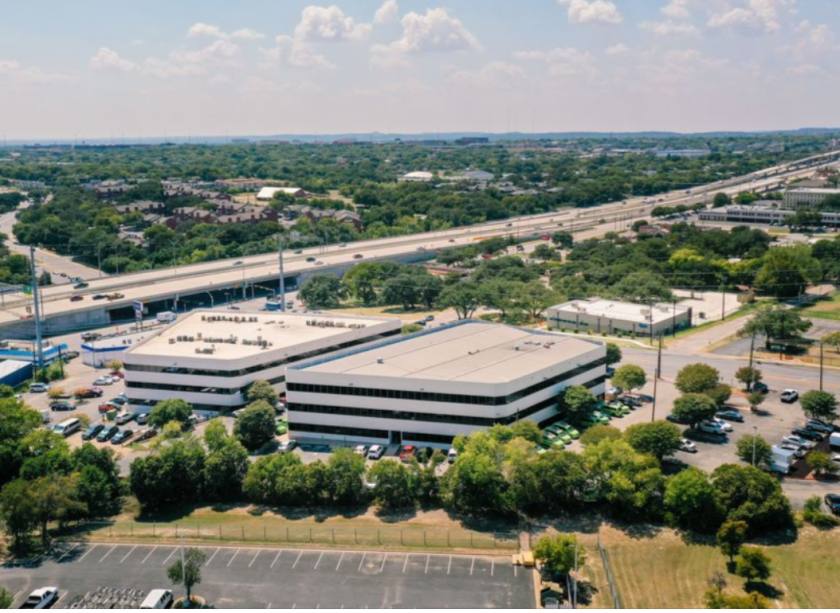
7901 Cameron Road Austin, TX 78754
7901 Cameron Road Austin, TX 78754
Details & Description
Property Highlights
- • BELOW MARKET IN-PLACE RENTS AND OCCUPANCY
- • BELOW MARKET IN-PLACE RENTS AND OCCUPANCY
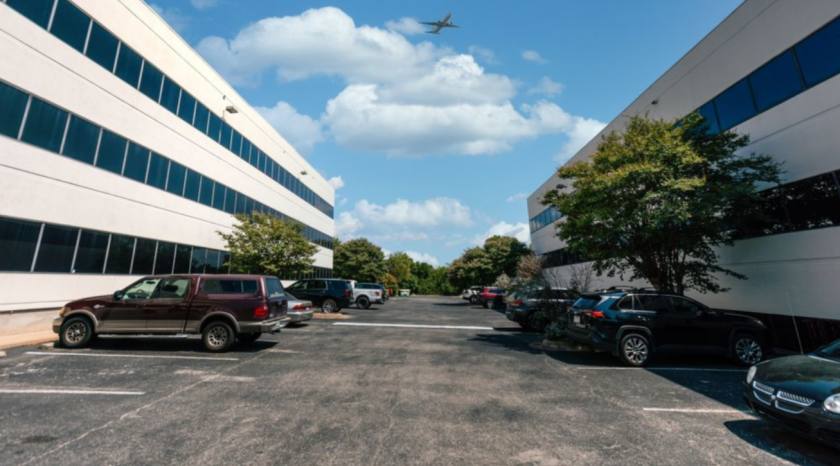
- • TRANSPORTATION THOROUGHFARE
- • THRIVING AUSTIN ECONOMY
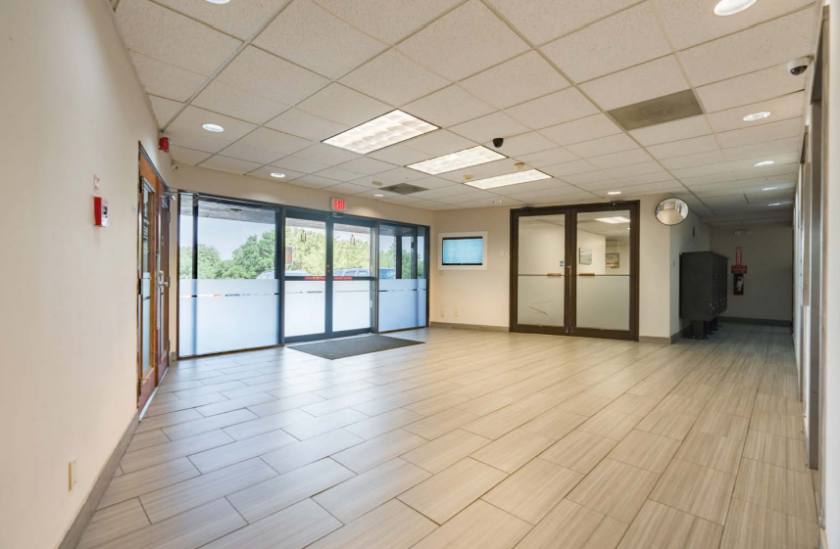
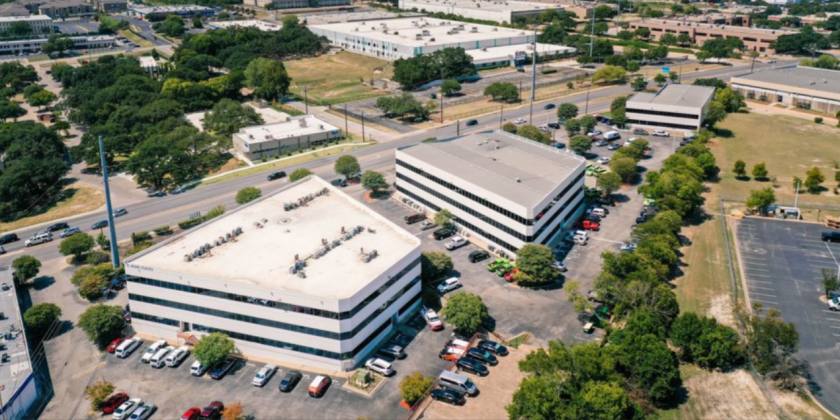
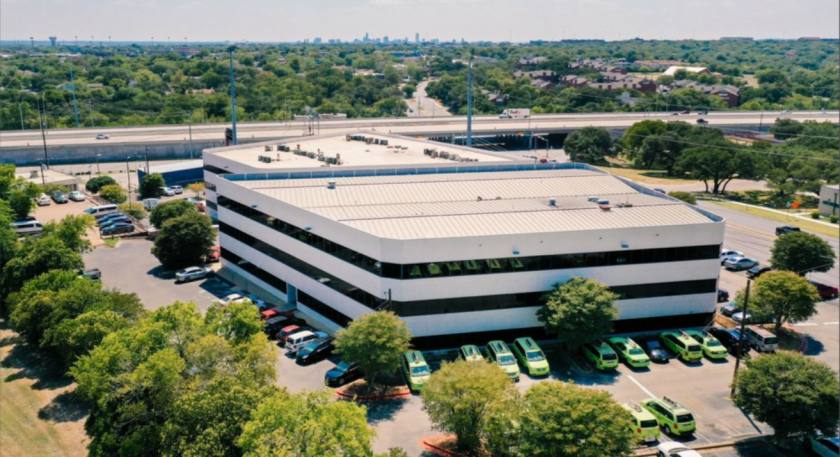
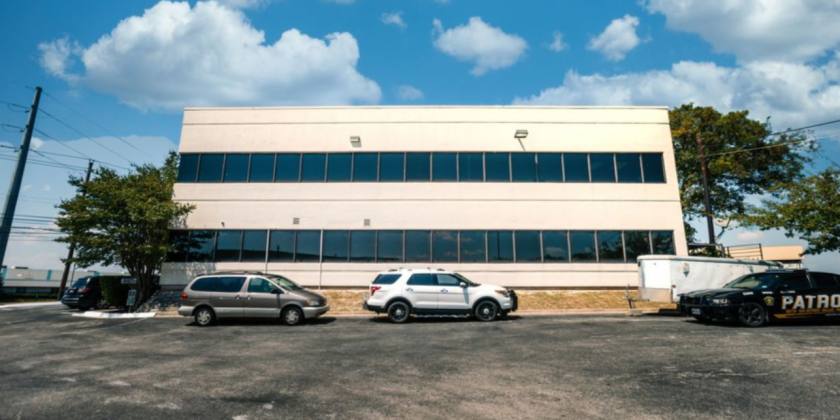
Additional Photos

Listing Agents

Jeremy Peterson
O: 512-391-0718
M: 413-949-0390
jpeterson@stcroixca.com
O: 512-391-0718
M: 413-949-0390
jpeterson@stcroixca.com

Stephen DePizzo
O: 512-391-0718
M: 614-570-1260
sdepizzo@stcroixca.com
O: 512-391-0718
M: 614-570-1260
sdepizzo@stcroixca.com
While we strive to provide the most accurate information, all listing information, and demographic data, is provided by third-parties. As such, MyEListing will not be responsible for the accuracy of the information. It is strongly recommended that you verify all information with the listing agent, and any relevant agencies, prior to making any decisions.