Retail Space
329 North Huron Street Toledo, OH 43604
329 North Huron Street Toledo, OH 43604

Details & Description
Property Highlights
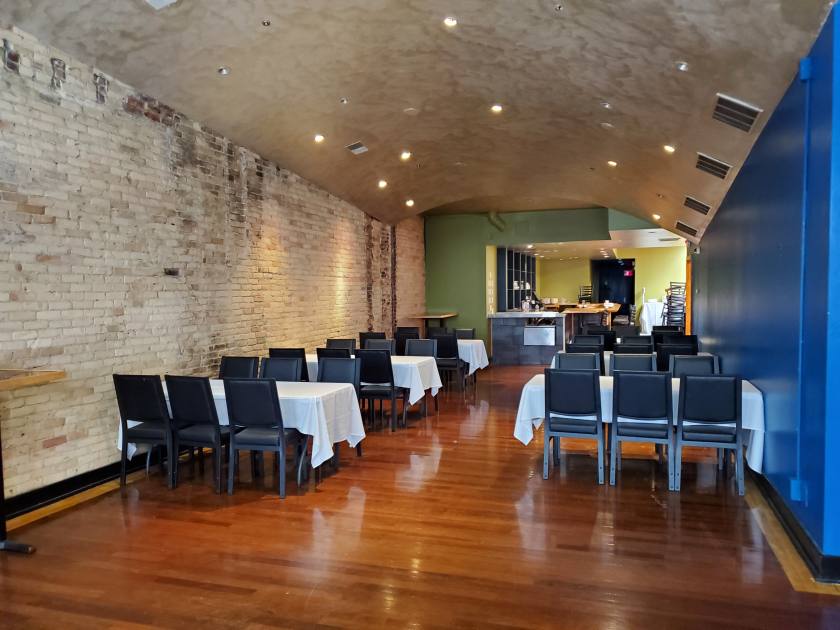
• Two story restaurant property in excellent condition
• Ample parking on street and in nearby lots
Additional Photos


Listing Agents

Steven Lennex
O: 734-856-6464
M: 419-356-8745
slennex@lennexrc.com
O: 734-856-6464
M: 419-356-8745
slennex@lennexrc.com
While we strive to provide the most accurate information, all listing information, and demographic data, is provided by third-parties. As such, MyEListing will not be responsible for the accuracy of the information. It is strongly recommended that you verify all information with the listing agent, and any relevant agencies, prior to making any decisions.


