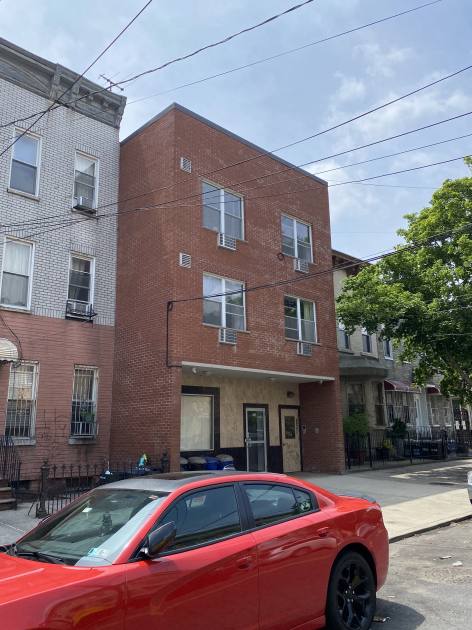
Office Space
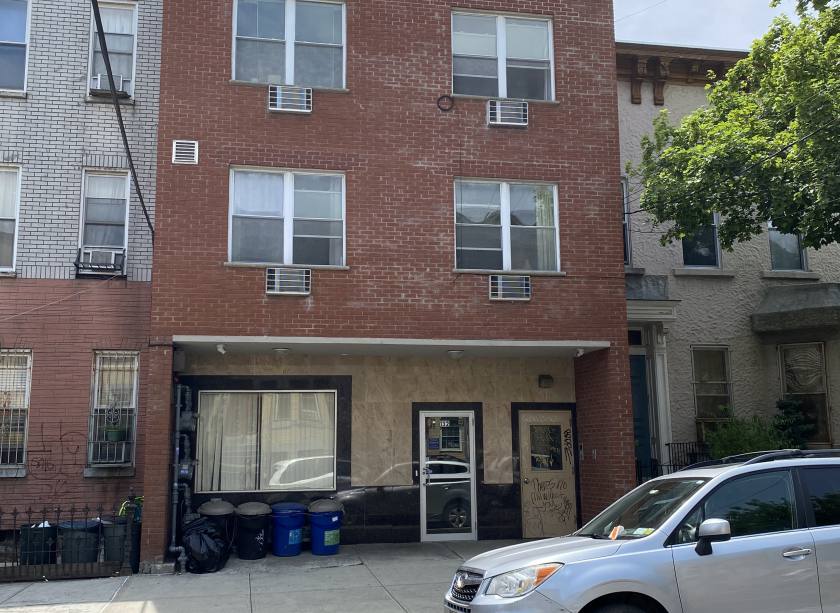
132 Saint Nicholas Avenue Brooklyn, NY 11237
132 Saint Nicholas Avenue Brooklyn, NY 11237
Details & Description
Property Highlights
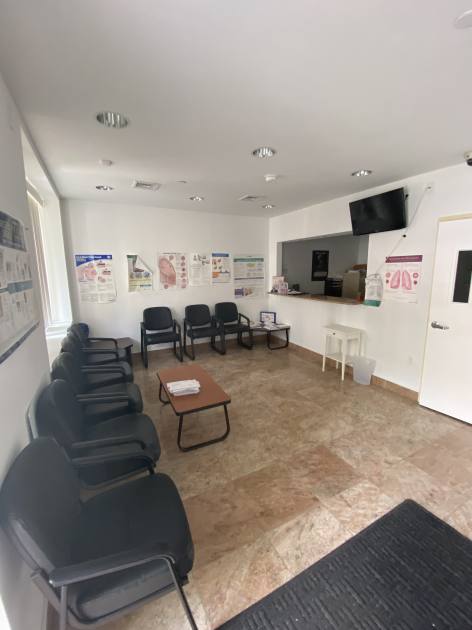
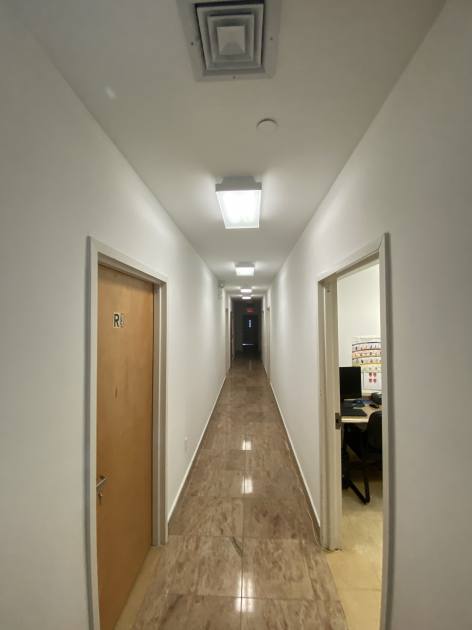
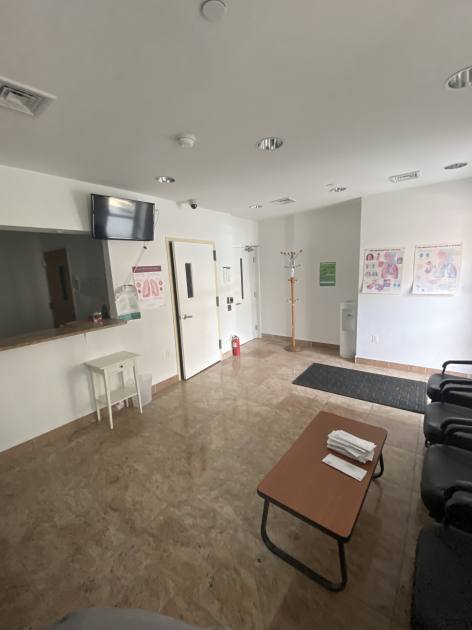
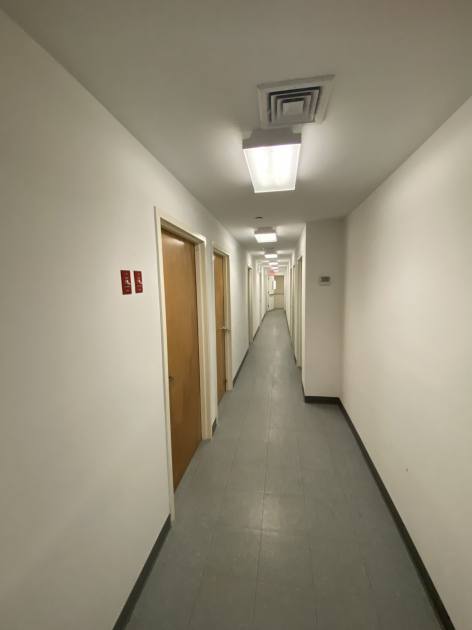
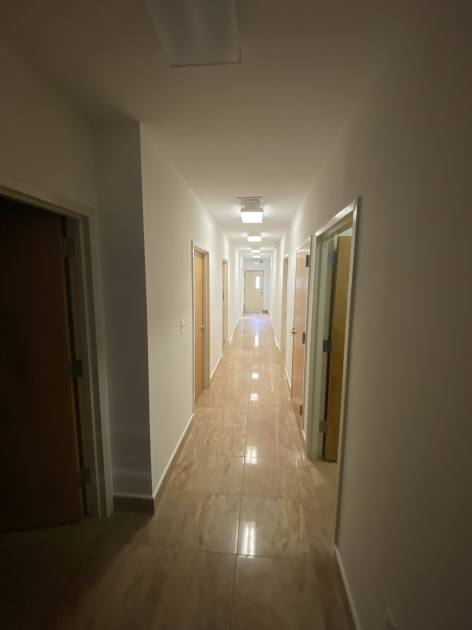
- • Bilevel office/medical space
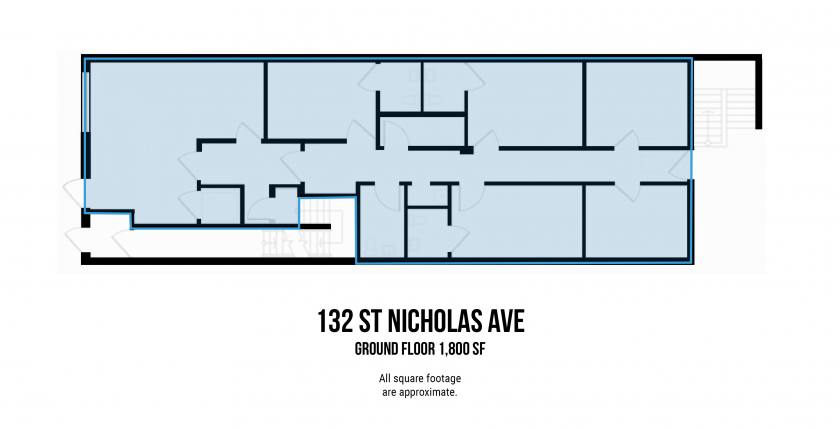
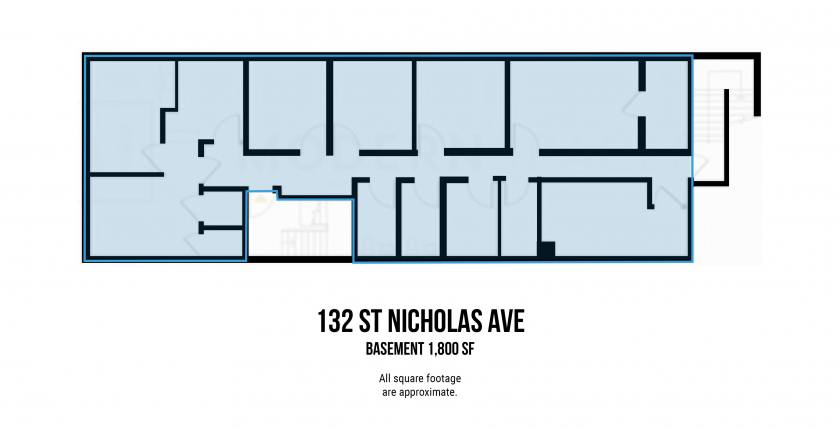
- • 1,800 SF on each floor
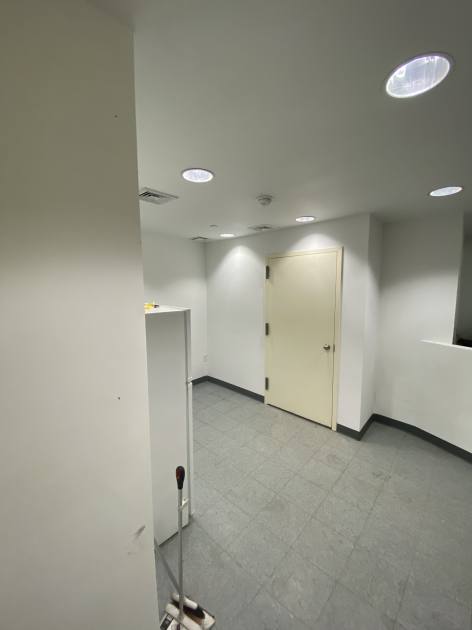
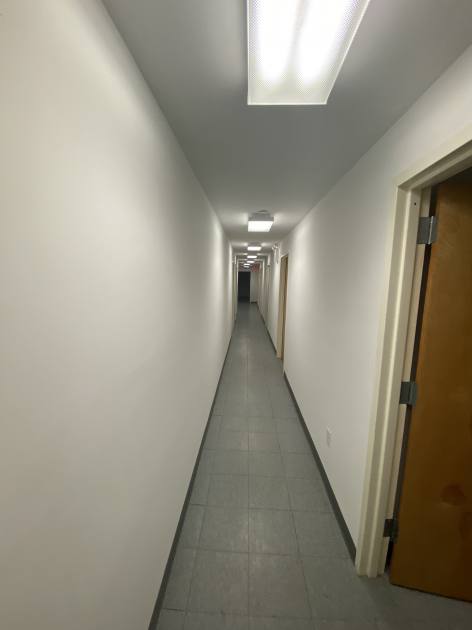
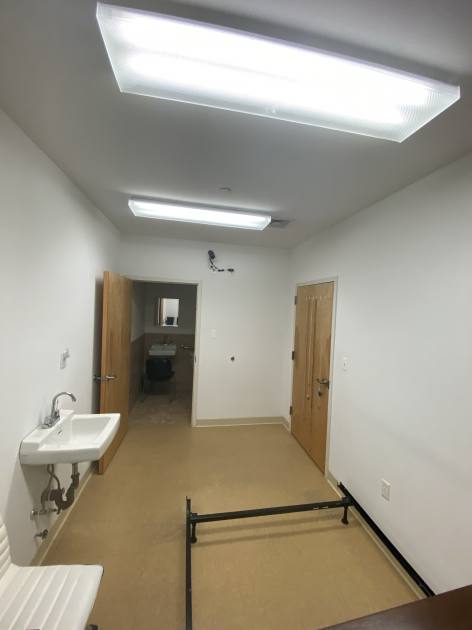
- • Fully built out medical space
- • 5 exam rooms on each floor
- • Bathrooms
- • ADA accessible
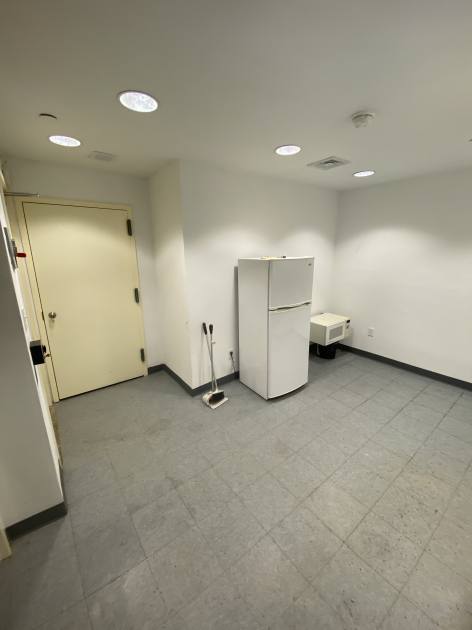
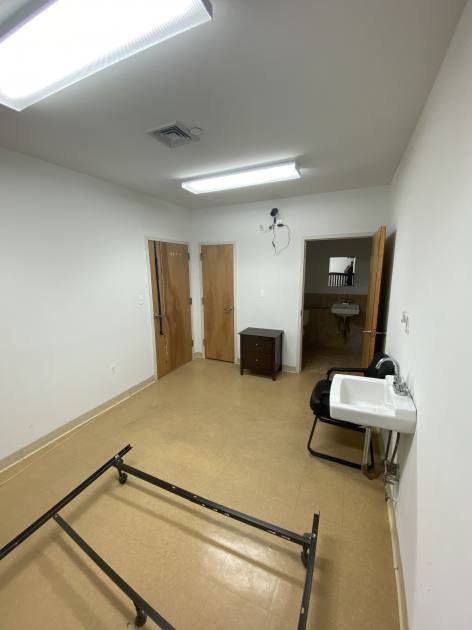
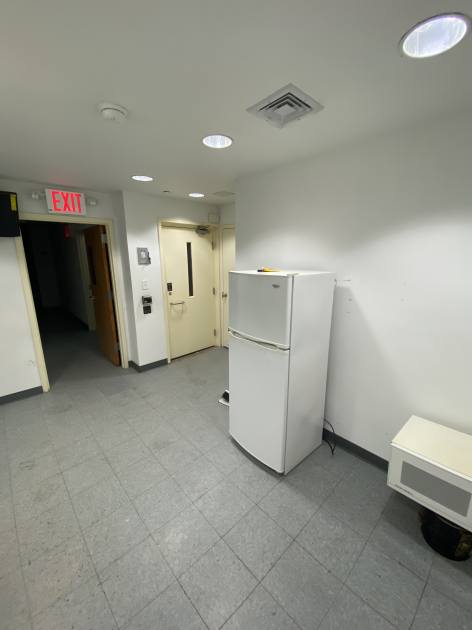
Additional Photos

Listing Agents

Shlomi Bagdadi
O: 718-437-6100
info@tristatecr.com
O: 718-437-6100
info@tristatecr.com
While we strive to provide the most accurate information, all listing information, and demographic data, is provided by third-parties. As such, MyEListing will not be responsible for the accuracy of the information. It is strongly recommended that you verify all information with the listing agent, and any relevant agencies, prior to making any decisions.