Industrial Properties
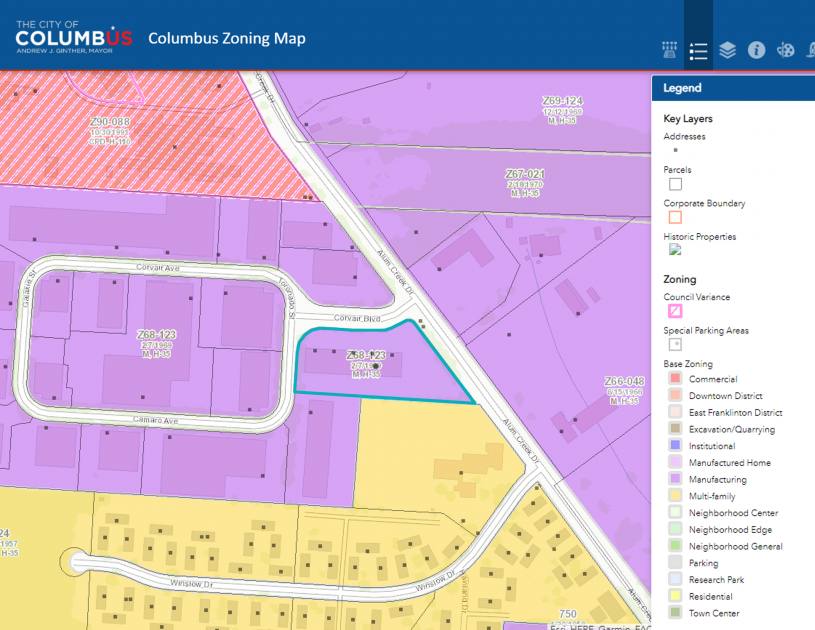
2089 Corvair Boulevard Columbus, OH 43207
2089 Corvair Boulevard Columbus, OH 43207
Details & Description
Property Highlights
- • 100 LEASED
- • 4.08 ACRE SITE
- • REMARKABLE OPPORTUNITY
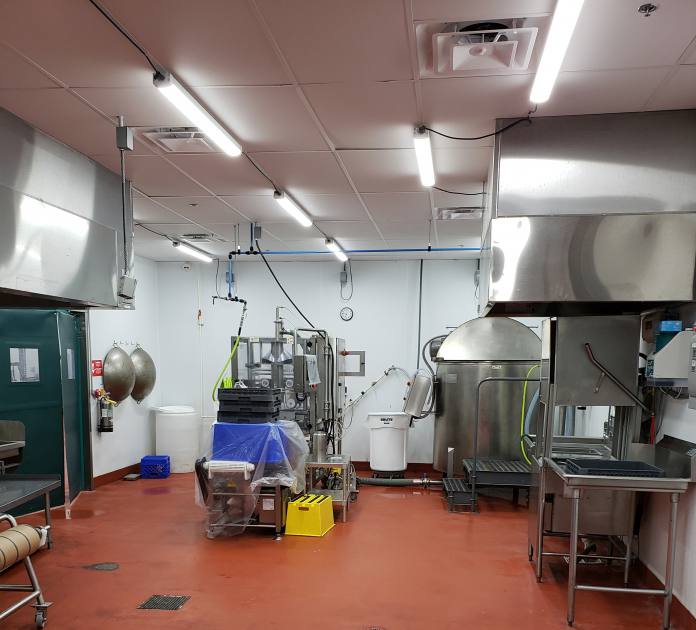
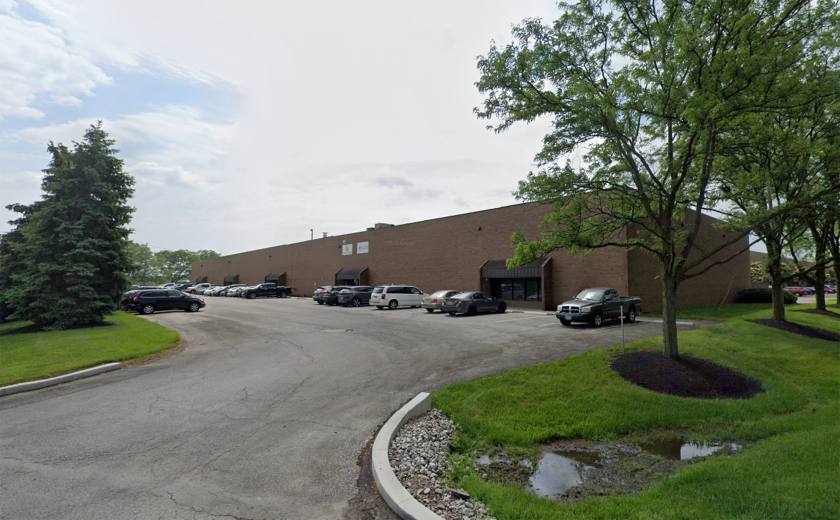
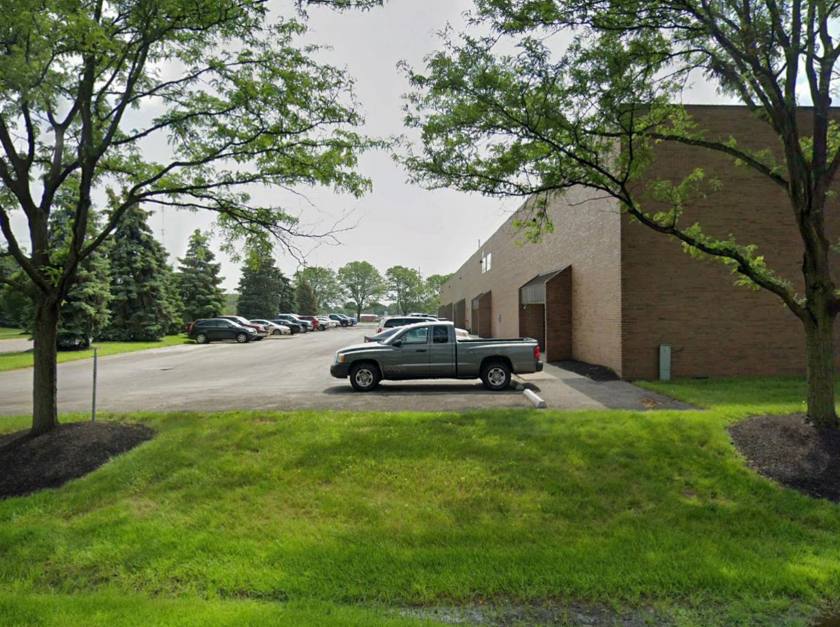
Additional Photos


Listing Agents

Skip Weiler
O: 614-221-4286
skip@rweiler.com
O: 614-221-4286
skip@rweiler.com
While we strive to provide the most accurate information, all listing information, and demographic data, is provided by third-parties. As such, MyEListing will not be responsible for the accuracy of the information. It is strongly recommended that you verify all information with the listing agent, and any relevant agencies, prior to making any decisions.