Office Space
3200 Fredericksburg Road San Antonio, TX 78201
3200 Fredericksburg Road San Antonio, TX 78201
Details & Description
Property Highlights
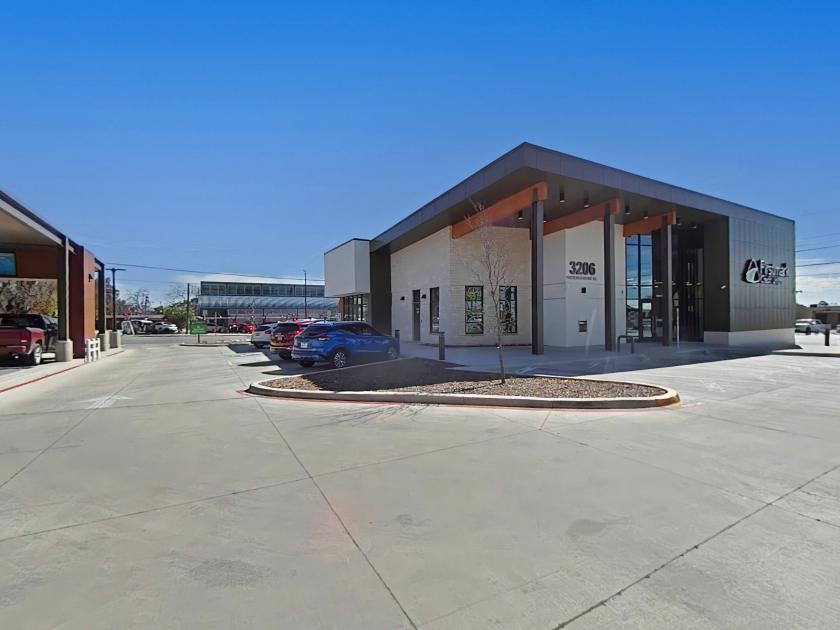
• • Located on the corner of Fredericksburg Rd. and Fresno St. in the Northwest Submarket.
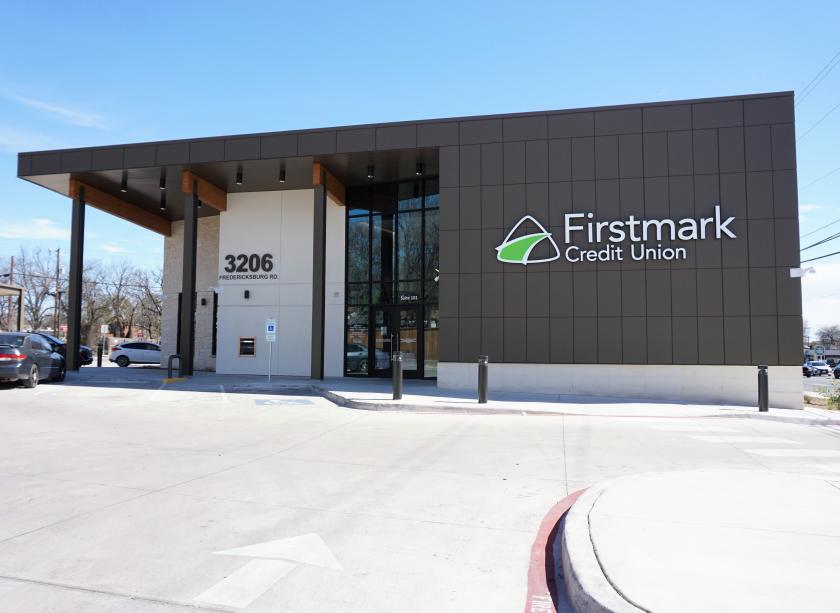
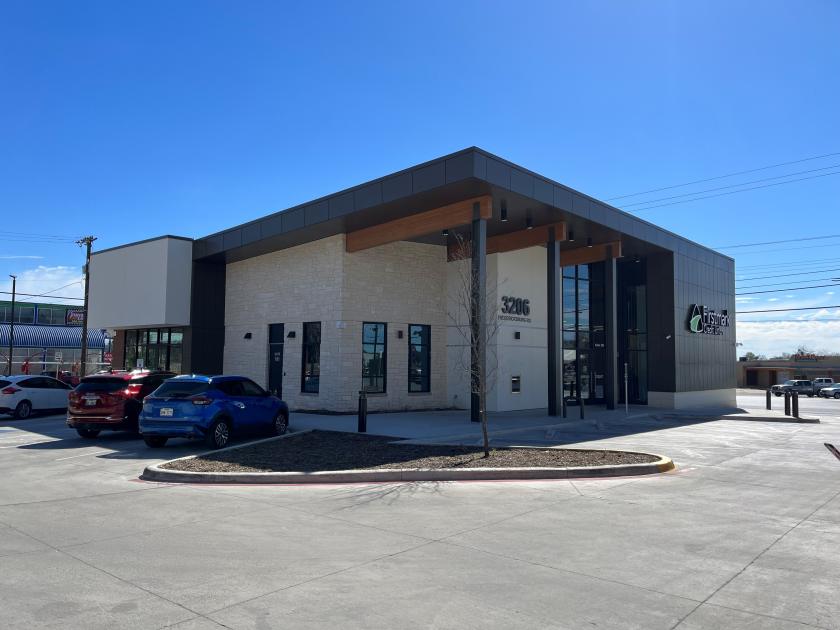
• • Adjacent to newly constructed Firstmark Credit Union.
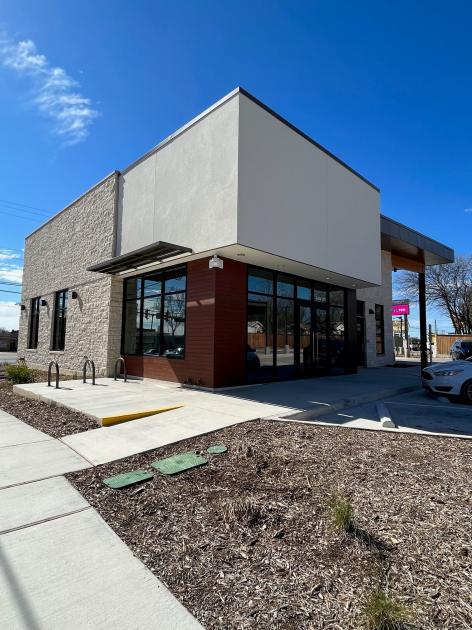
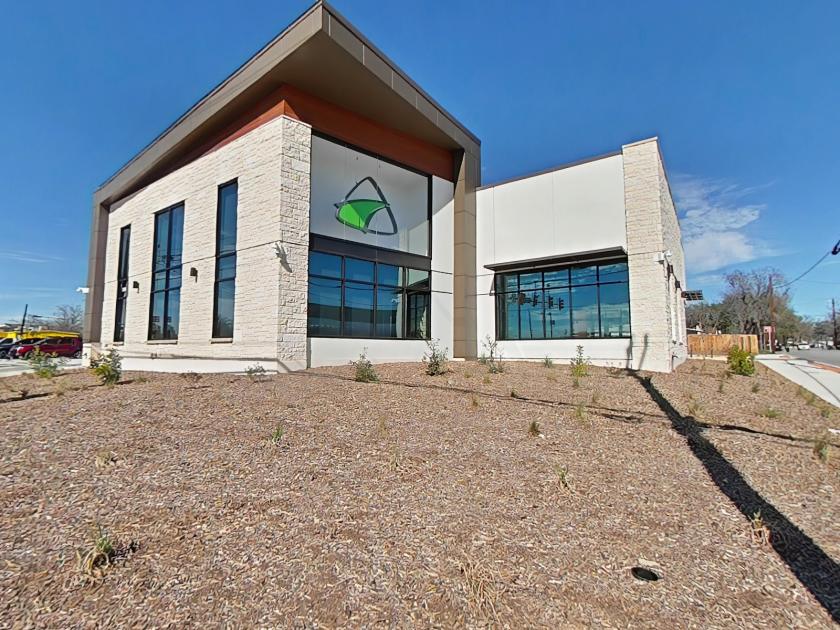
Additional Photos
Listing Agents

Eric Lundblad
M: 210-918-6402
elundblad@endurasa.com
M: 210-918-6402
elundblad@endurasa.com
While we strive to provide the most accurate information, all listing information, and demographic data, is provided by third-parties. As such, MyEListing will not be responsible for the accuracy of the information. It is strongly recommended that you verify all information with the listing agent, and any relevant agencies, prior to making any decisions.


