Property Highlights
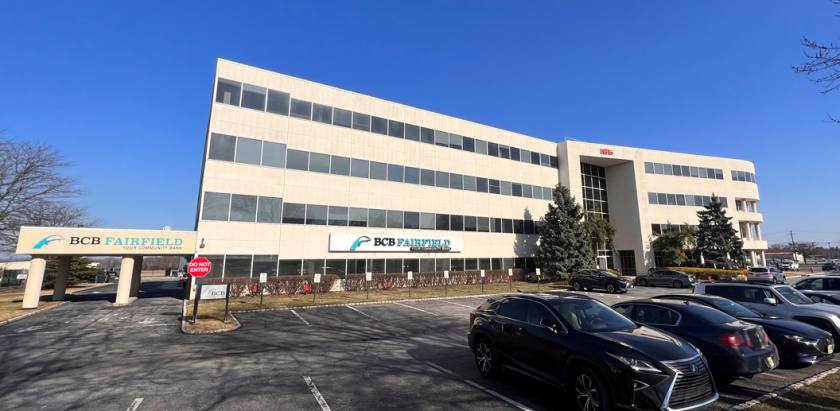
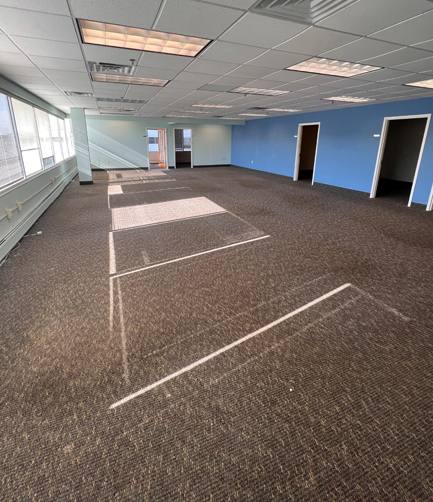
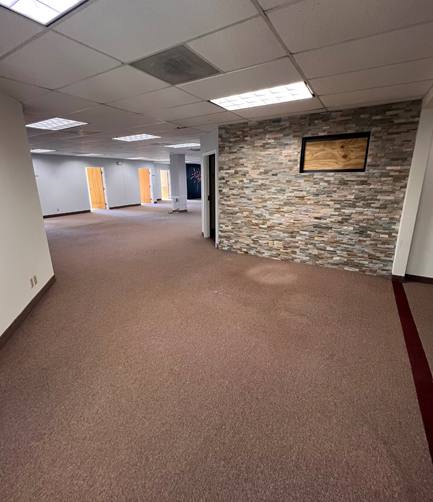
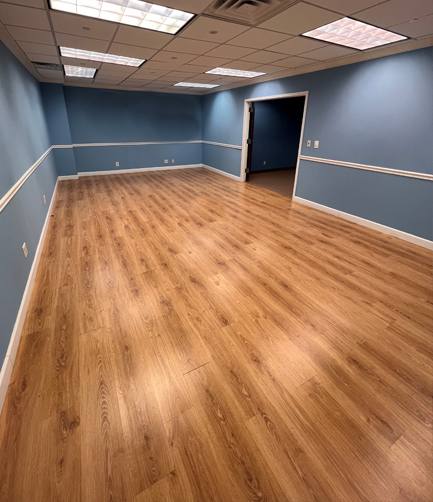
±105,253 SF Professional Office / Medical Space
Newly Renovated Common Areas and Elevator Cabs
Plug N' Play Space Available
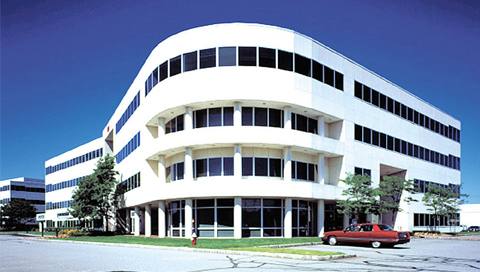
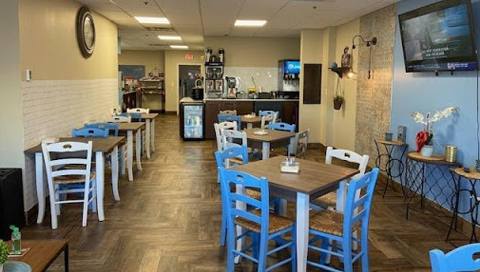
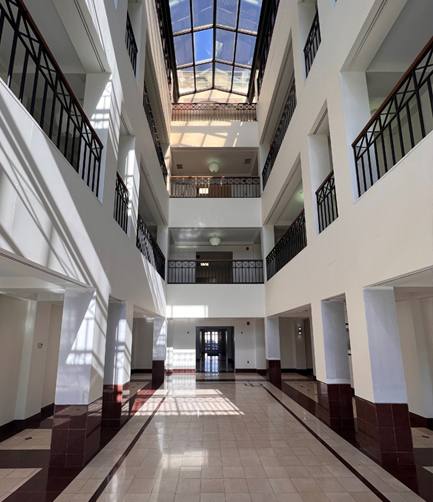
Four Story Atrium, Full-Service Café, Views of Fairfield Airport
Abundant Parking Space (6/1,000 Parking)
Close Proximity to Ample Dining and Lodging Amenities
Ownership to Refresh Main Lobby & Common Areas (New Paint, Furniture, Lighting and Indoor Landscaping)
Stable Ownership Group
Available Immediately
Convenient Access to All Major Highways (Routes 3 and 46, I-80 and 280)Plus $2.00 PSF TE
Location
Approx. 1.4 Miles to Route 46
Approx. 2.4 Miles to I-80
Approx. 5.8 Miles to I-280
Approx. 6.9 Miles to Route 3
No part of this information may be copied, reproduced, repurposed, or screen-captured for any commercial purpose without prior written authorization from MyEListing.
While we strive to provide the most accurate information, all listing information, and demographic data, is provided by third-parties. As such, MyEListing will not be responsible for the accuracy of the information. It is strongly recommended that you verify all information with the listing agent, and any relevant agencies, prior to making any decisions.
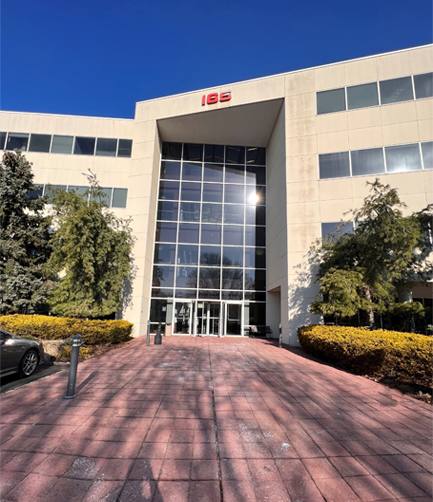
What is the asking price for 165 Passaic Avenue in Fairfield?
The asking price for 165 Passaic Avenue is $19.25 a SF per Year
What is the building size of this commercial Office property?
The size of this lease property at '.165 Passaic Avenue.' is 105253 square feet
What kind of Office is the propery at 165 Passaic Avenue?
The property at 165 Passaic Avenue Fairfield, NJ 07004 is listed as a Professional Office property
What is the population within 1 mile of 165 Passaic Avenue in Fairfield?
The population within 1 mile of 165 Passaic Avenue Fairfield, NJ 07004 is 3,603 people.
Who do I contact for questions about 165 Passaic Avenue?
You should contact the listing agent,
Dylan Meade, for any details regarding this commercial listing.