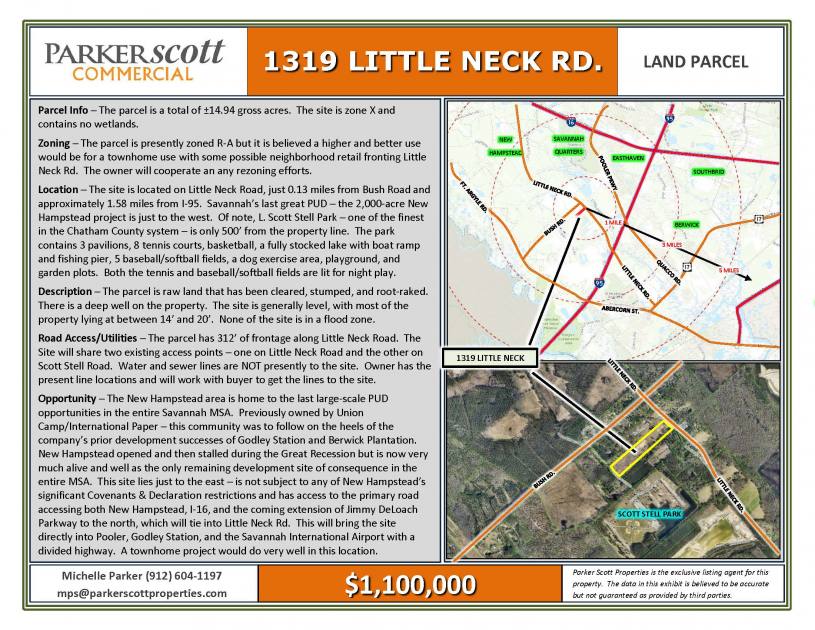
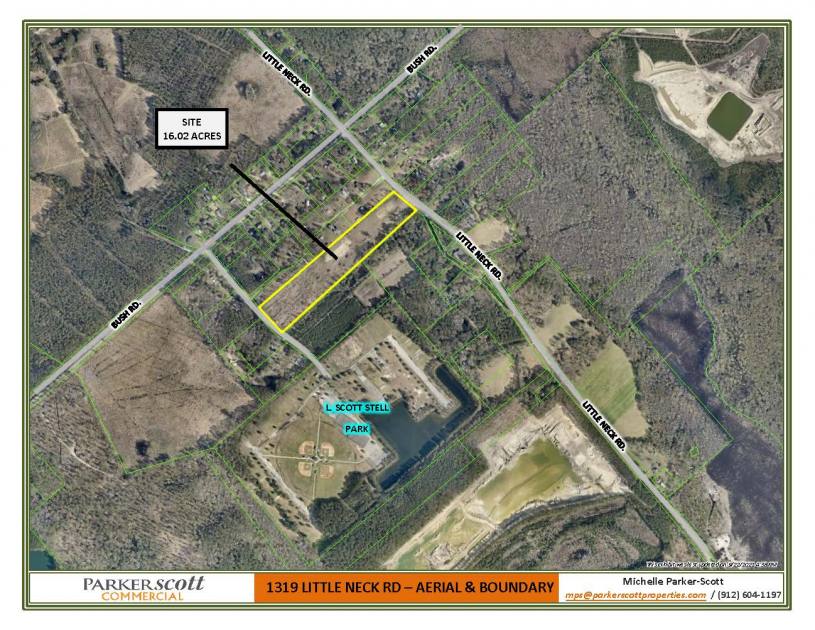
Parcel Info – The parcel is a total of ±14.94 gross acres. The site is zone X and contains no wetlands.Zoning – The parcel is presently zoned R-A but it is believed a higher and better use would be for a townhome use with some possible neighborhood retail fronting Little Neck Rd. The owner will cooperate an any rezoning efforts.Location – The site is located on Little Neck Road, just 0.13 miles from Bush Road and approximately 1.58 miles from I-95. Savannah’s last great PUD – the 2,000-acre New Hampstead project is just to the west. Of note, L. Scott Stell Park – one of the finest in the Chatham County system – is only 500’ from the property line. The park contains 3 pavilions, 8 tennis courts, basketball, a fully stocked lake with boat ramp and fishing pier, 5 baseball/softball fields, a dog exercise area, playground, and garden plots. Both the tennis and baseball/softball fields are lit for night play.Description – The parcel is raw land that has been cleared, stumped, and root-raked. There is a deep well on the property. The site is generally level, with most of the property lying at between 14’ and 20’. None of the site is in a flood zone.Road Access/Utilities – The parcel has 312’ of frontage along Little Neck Road. The Site will share two existing access points – one on Little Neck Road and the other on Scott Stell Road. Water and sewer lines are NOT presently to the site. Opportunity – The New Hampstead area is home to the last large-scale PUD opportunities in the entire Savannah MSA. Previously owned by Union Camp/International Paper – this community was to follow on the heels of the company’s prior development successes of Godley Station and Berwick Plantation. New Hampstead opened and then stalled during the Great Recession but is now very much alive and well as the only remaining development site of consequence in the entire MSA. This site lies just to the east – is not subject to any of New Hampstead’s significant Covenants & Declaration restrictions and has access to the primary road accessing both New Hampstead, I-16, and the coming extension of Jimmy DeLoach Parkway to the north, which will tie into Little Neck Rd. This will bring the site directly into Pooler, Godley Station, and the Savannah International Airport with a divided highway. A townhome project would do very well in this location.