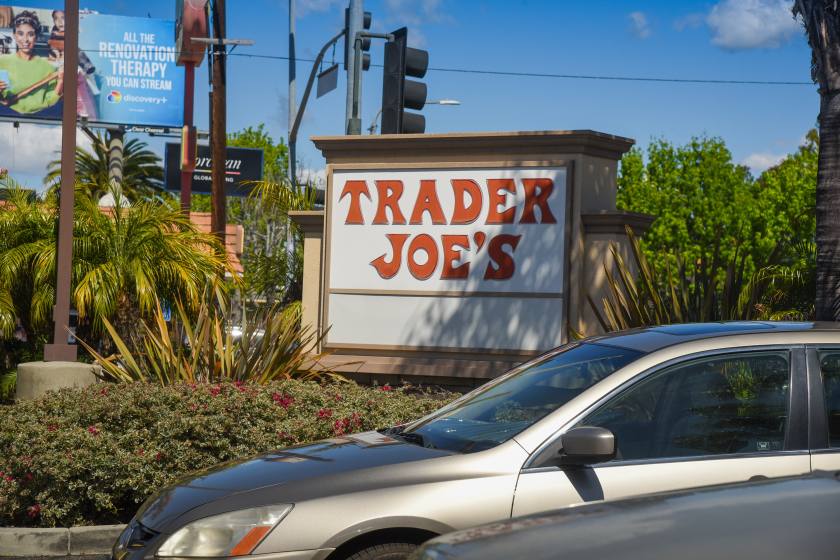
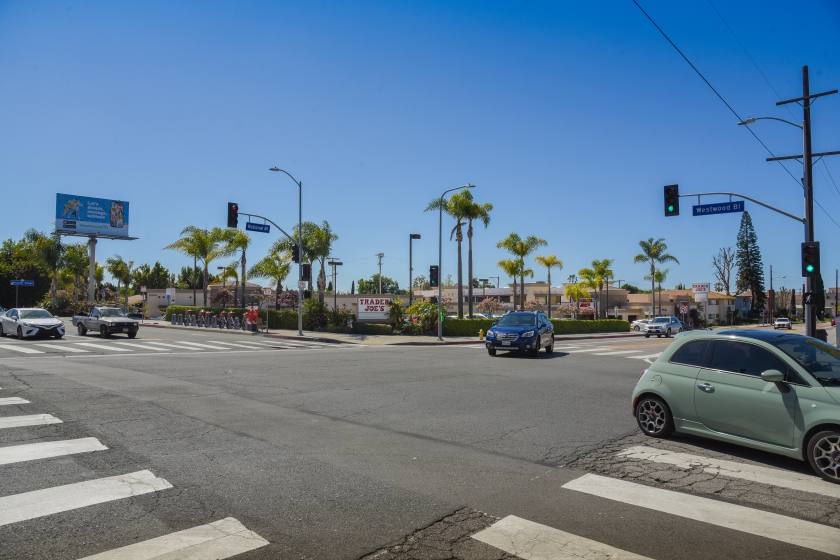
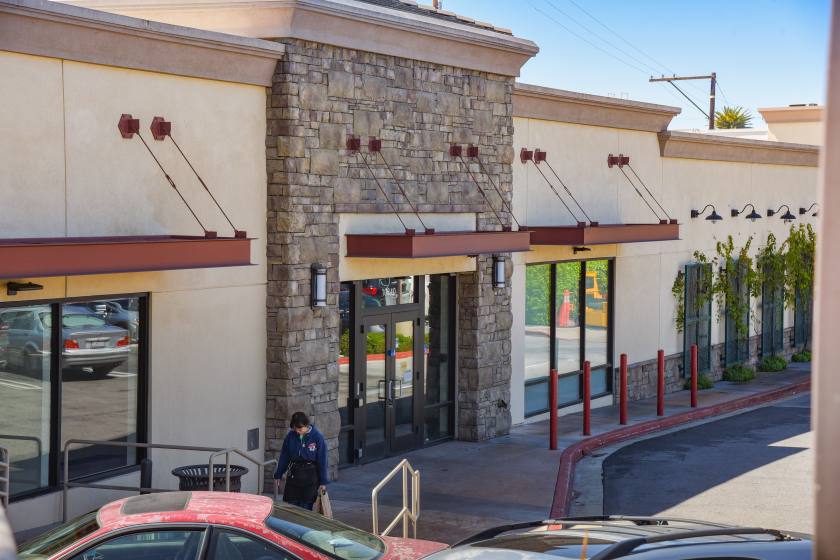
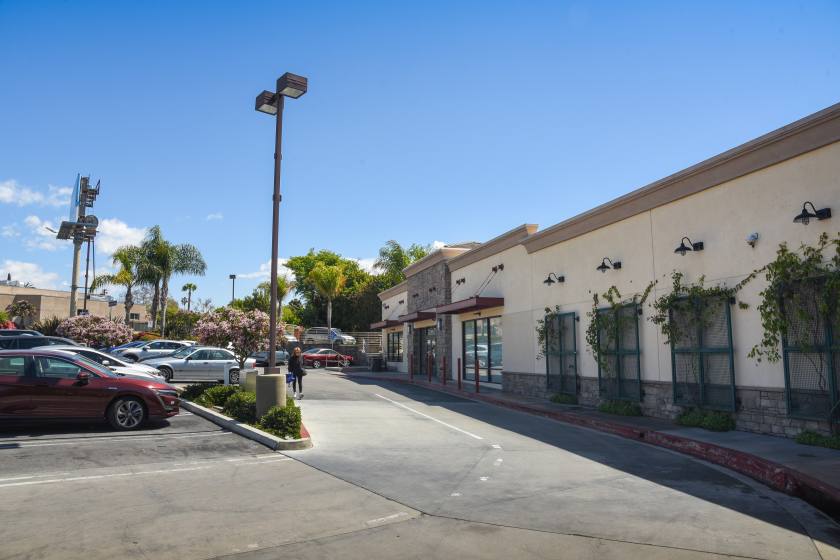
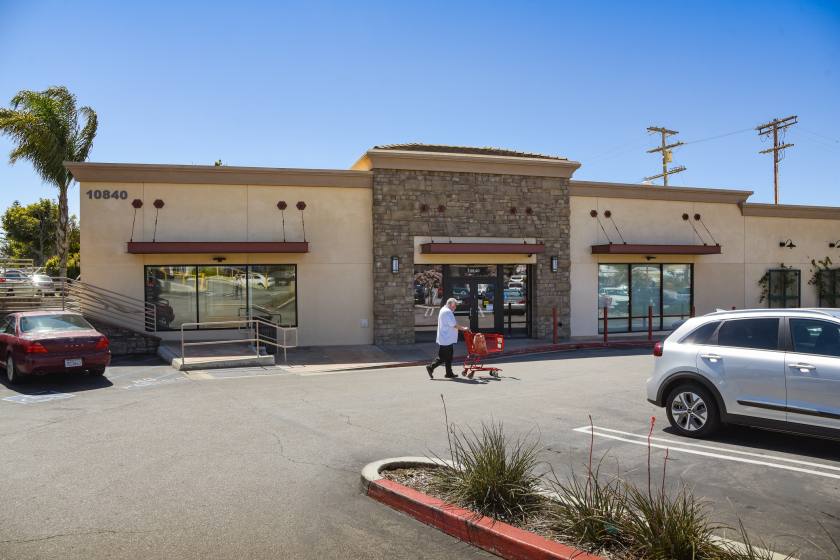
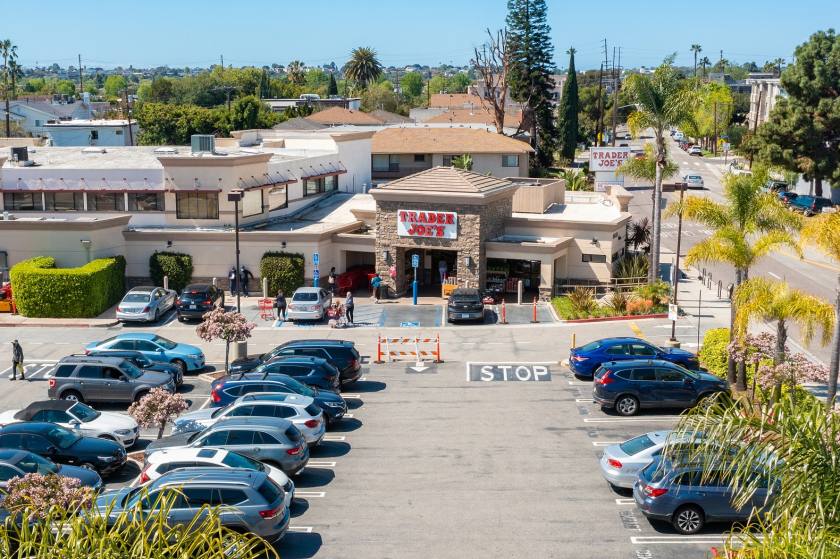
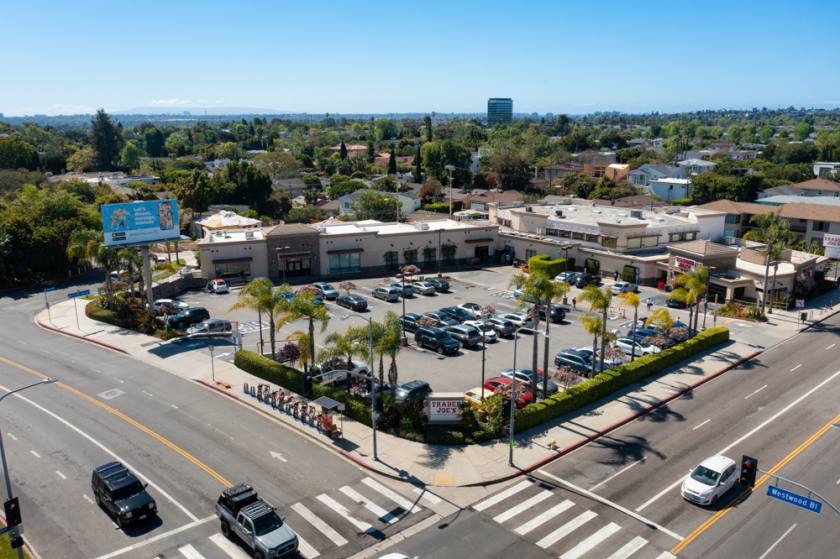
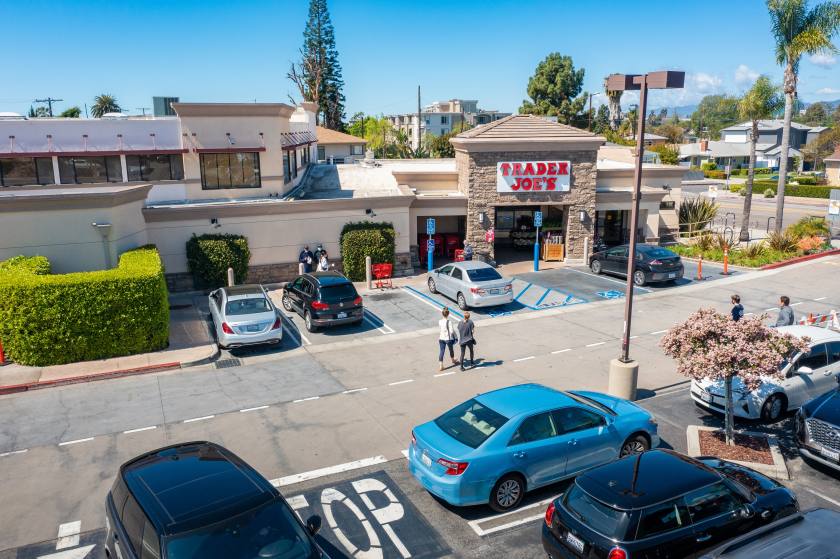
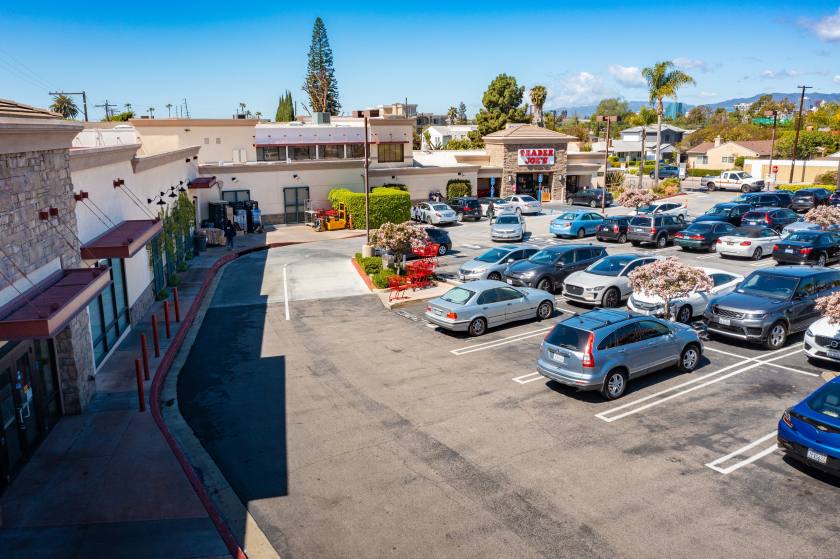
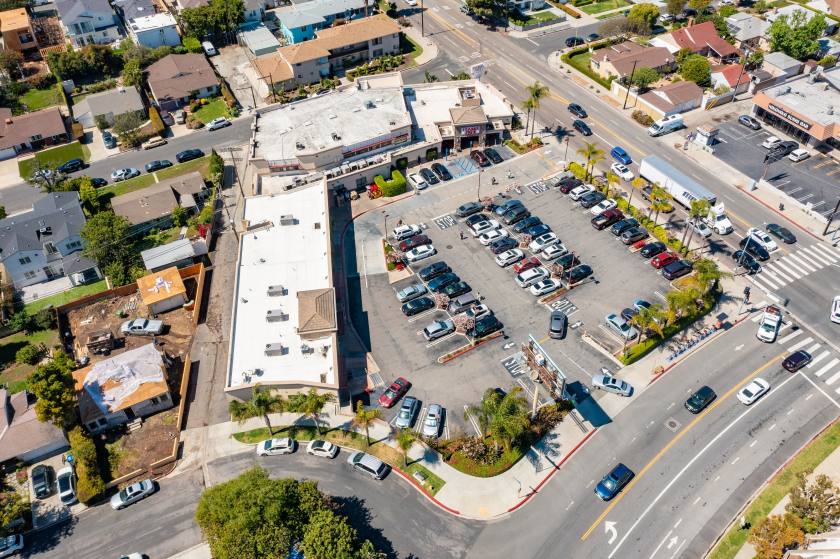
1-Mile | 3-Miles | 5-Miles | ||
---|---|---|---|---|
Total Population | 39,386 | 320,950 | 742,386 | |
Population Median Age | 38 | 39 | 40 | |
Population by Age | 0-9 Yrs | 3711 (9%) | 30412 (9%) | 66395 (8%) |
10-19 Yrs | 2404 (6%) | 24884 (7%) | 69712 (9%) | |
20-29 Yrs | 7718 (19%) | 60481 (18%) | 130190 (17%) | |
30-39 Yrs | 9853 (25%) | 61156 (19%) | 136655 (18%) | |
40-49 Yrs | 4469 (11%) | 42165 (13%) | 97849 (13%) | |
50-59 Yrs | 4329 (10%) | 36655 (11%) | 88041 (11%) | |
60-69 Yrs | 3363 (8%) | 30958 (9%) | 74613 (10%) | |
70+ Yrs | 3539 (8%) | 34239 (10%) | 78931 (10%) | |
Median HH Income | $85,290 | $88,624 | $90,333 | |
Total Household Income | < 24K | 2204 (11%) | 21601 (14%) | 53369 (15%) |
25-49K | 2855 (15%) | 20569 (14%) | 47336 (14%) | |
50-74K | 3040 (16%) | 20454 (14%) | 44227 (13%) | |
75-99K | 2669 (14%) | 17692 (12%) | 37141 (11%) | |
100-199K | 4915 (26%) | 38666 (26%) | 89356 (26%) | |
200K+ | 2712 (14%) | 25552 (17%) | 64000 (19%) | |
Highest Education Level | No Diploma | 1391 | 18098 | 40614 |
Diploma or GED | 2629 | 23967 | 57427 | |
Some College | 4320 | 35636 | 85033 | |
Assoc. Degree | 1582 | 12204 | 29733 | |
Bachelors Degree | 11905 | 87854 | 196948 | |
Higher Degree | 9231 | 65275 | 143220 | |
Total Housing Units | 20,107 | 158,380 | 373,586 | |
--Owner-Occupied | 5,171 | 50,224 | 117,003 | |
--Renter-Occupied | 13,224 | 94,310 | 218,425 | |
Owner-Occupied Values | < 100K | 117 | 793 | 1980 |
100-199K | 21 | 691 | 1092 | |
200-299K | 45 | 638 | 1264 | |
300-399K | 39 | 890 | 2674 | |
400-499K | 115 | 1589 | 4405 | |
500K+ | 4834 | 45623 | 105589 | |
Total Working Age Population | 34,003 | 274,999 | 639,976 | |
In Work Force | 25,596 | 193,805 | 441,432 | |
Not In Work Force | 8,407 | 81,195 | 198,544 | |
Workforce Employed | 24,333 | 183,906 | 414,842 | |
Workforce Unemployed | 1,250 | 9,776 | 26,226 | |
Civlian Workforce | 25,582 | 193,682 | 441,067 | |
Military Workforce | 14 | 123 | 365 | |
Total Households | 18,395 | 144,534 | 335,428 | |
Family Households | 8,141 | 65,626 | 150,226 | |
Non-Family Households | 10,254 | 78,908 | 185,202 | |
Married Couple | 6,390 | 49,776 | 111,928 | |
Other Family | 1,751 | 15,850 | 38,298 | |
Married w/Child | 2,432 | 19,855 | 42,360 | |
Single Male w/Child | 174 | 1,783 | 4,495 | |
Single Female w/Child | 407 | 4,147 | 11,122 |
Population Change Last Two Decades - Plus Projection
2000 | % | 2010 | % | 2020 | % | 2030 | |
---|---|---|---|---|---|---|---|
California | 33,871,648 | +10 | 37,253,956 | +9 | 40,467,295 | +8 | 43,631,295 |
Los Angeles County | 9,519,338 | +3 | 9,818,605 | +6 | 10,369,367 | +4 | 10,759,850 |
Total Working Age Population:
Total Households:
Total Working Age Population:
Total Households:
Total Working Age Population:
Total Households: