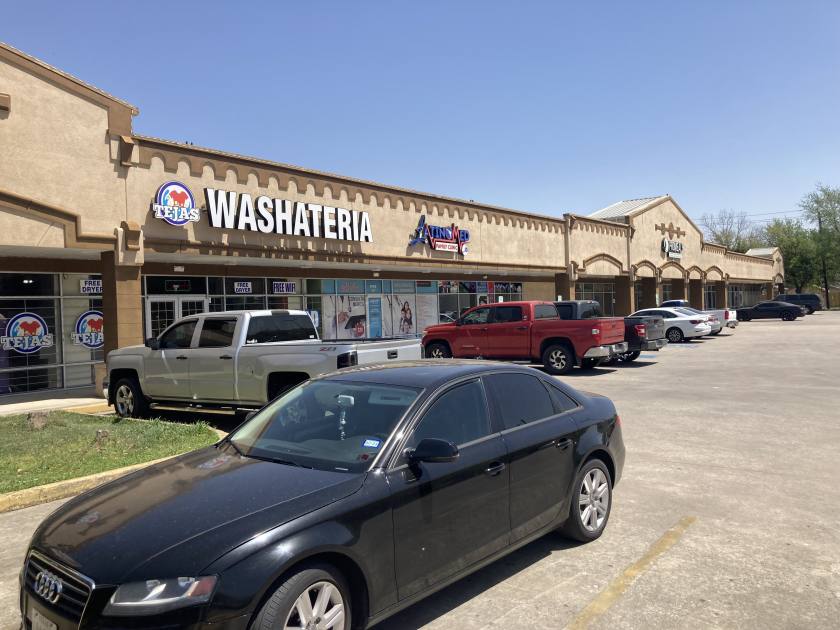
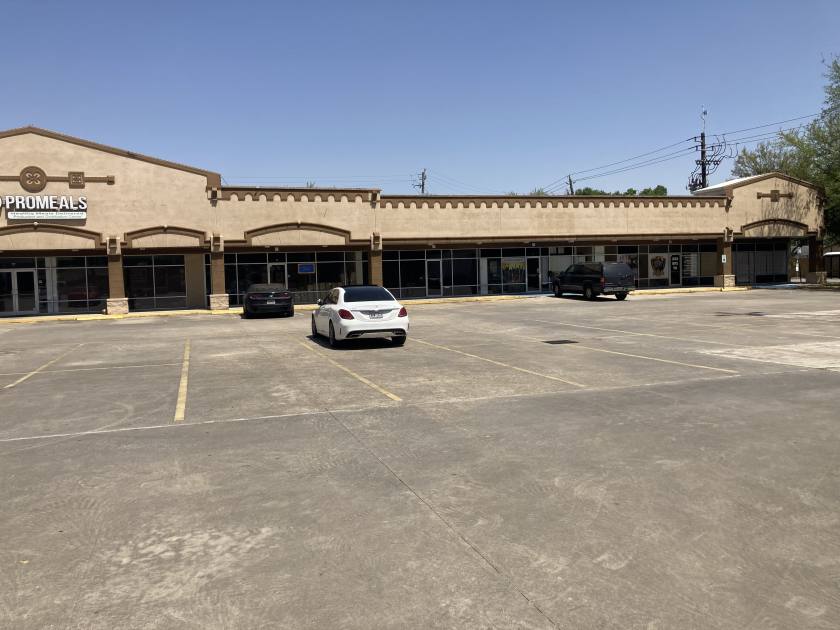
Retail Space
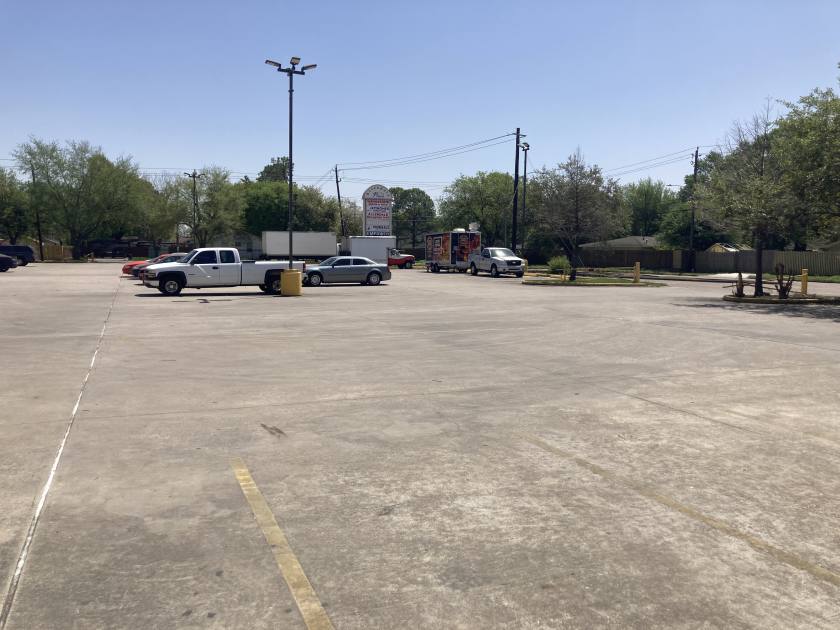
5455 Allendale Road Houston, TX 77017
5455 Allendale Road Houston, TX 77017
Details & Description
Property Highlights
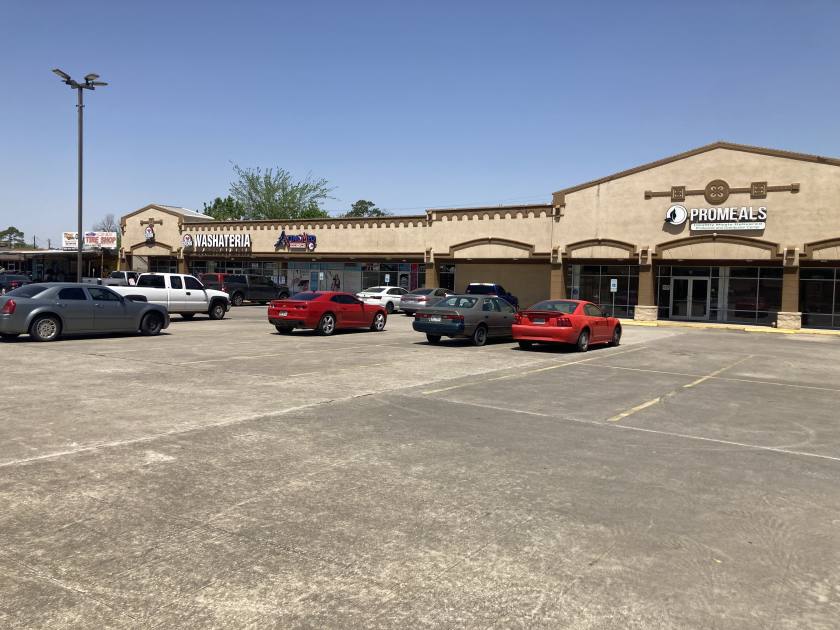
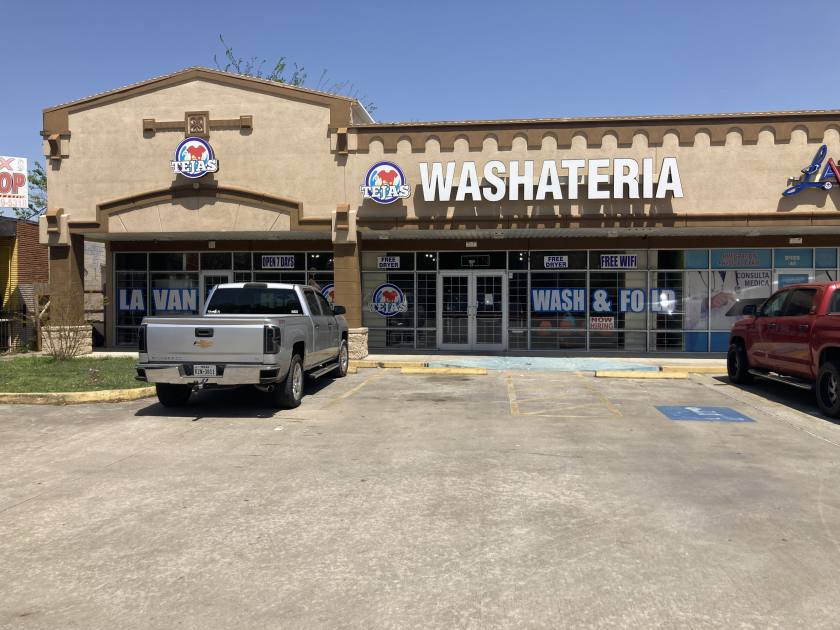
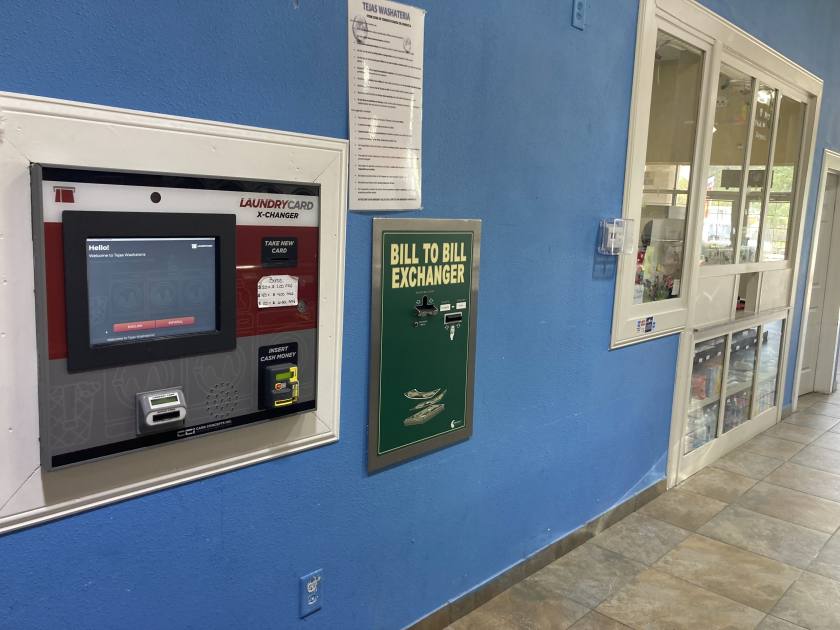
• Retail center and washateria
• Retail center and washateria
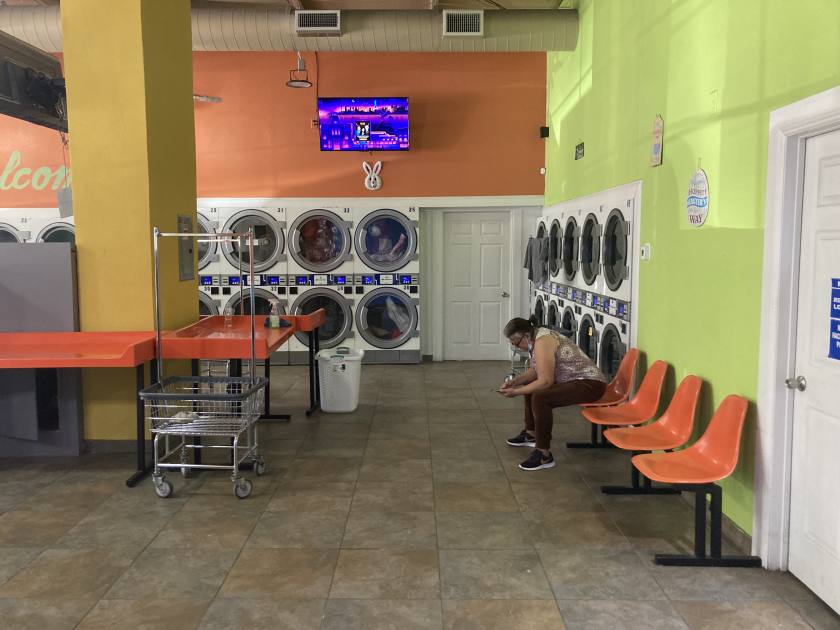
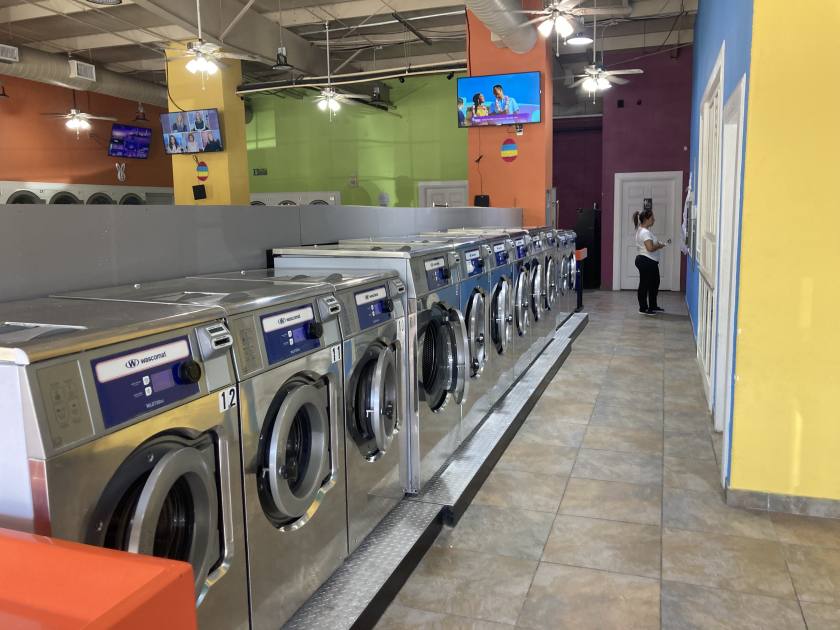
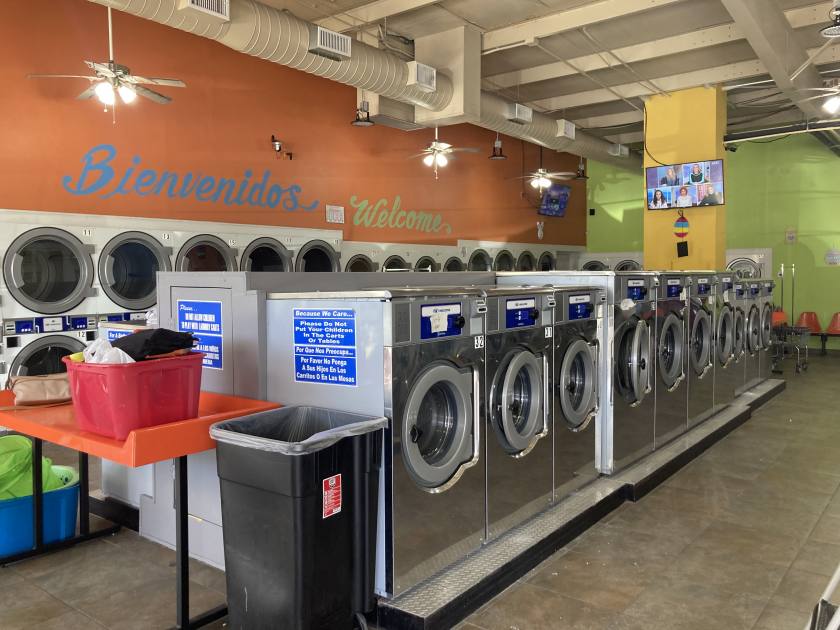
Additional Photos
Listing Agents

Sne Patel
O: 832-754-1197
snepatelproperties75@gmail.com
O: 832-754-1197
snepatelproperties75@gmail.com
While we strive to provide the most accurate information, all listing information, and demographic data, is provided by third-parties. As such, MyEListing will not be responsible for the accuracy of the information. It is strongly recommended that you verify all information with the listing agent, and any relevant agencies, prior to making any decisions.