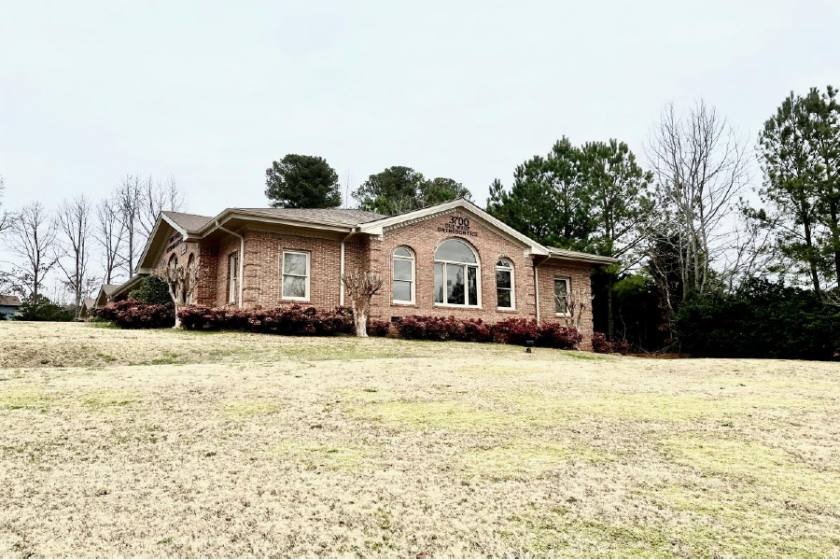
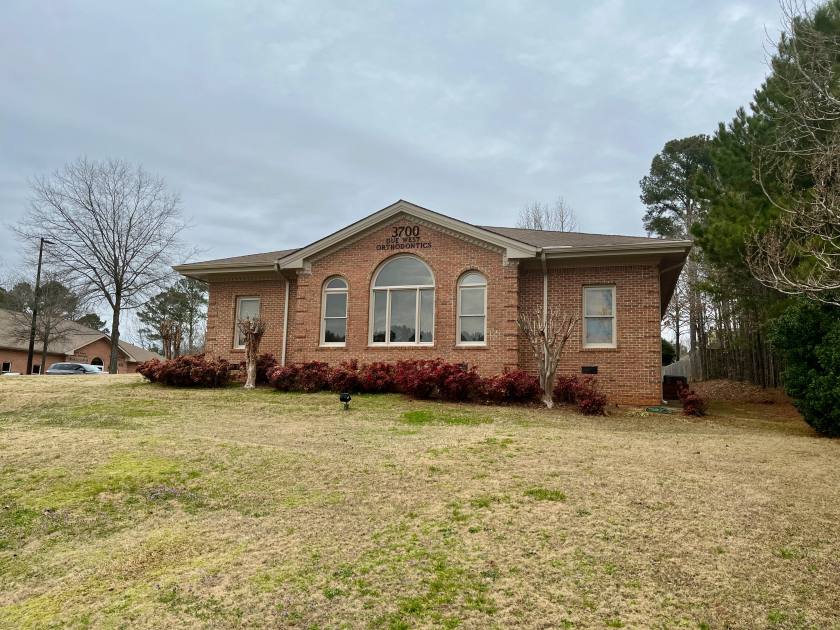
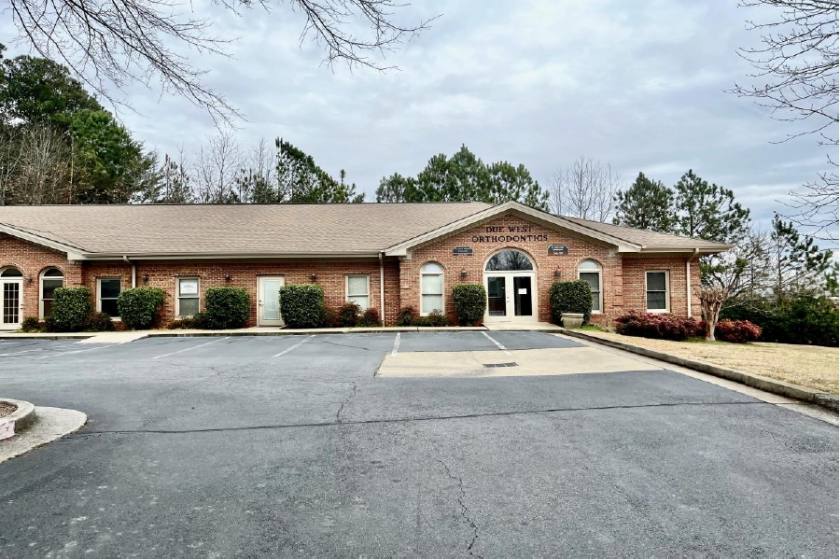
1-Mile | 3-Miles | 5-Miles | ||
---|---|---|---|---|
Total Population | 4,034 | 37,085 | 125,573 | |
Population Median Age | 43 | 40 | 38 | |
Population by Age | 0-9 Yrs | 360 (8%) | 4328 (11%) | 15734 (12%) |
10-19 Yrs | 535 (13%) | 5889 (15%) | 19078 (15%) | |
20-29 Yrs | 384 (9%) | 3217 (8%) | 13128 (10%) | |
30-39 Yrs | 368 (9%) | 3966 (10%) | 15037 (11%) | |
40-49 Yrs | 570 (14%) | 5091 (13%) | 18095 (14%) | |
50-59 Yrs | 819 (20%) | 6767 (18%) | 20349 (16%) | |
60-69 Yrs | 537 (13%) | 4457 (12%) | 13842 (11%) | |
70+ Yrs | 462 (11%) | 3370 (9%) | 10312 (8%) | |
Median HH Income | $109,469 | $117,596 | $98,973 | |
Total Household Income | < 24K | 101 (6%) | 796 (6%) | 3517 (8%) |
25-49K | 228 (15%) | 1347 (10%) | 6061 (14%) | |
50-74K | 156 (10%) | 1428 (11%) | 6134 (14%) | |
75-99K | 166 (11%) | 1623 (12%) | 6147 (14%) | |
100-199K | 559 (38%) | 4925 (39%) | 15103 (34%) | |
200K+ | 237 (16%) | 2387 (19%) | 6252 (14%) | |
Highest Education Level | No Diploma | 128 | 1001 | 4950 |
Diploma or GED | 615 | 4209 | 15777 | |
Some College | 575 | 4522 | 16229 | |
Assoc. Degree | 187 | 1713 | 5566 | |
Bachelors Degree | 878 | 8267 | 25896 | |
Higher Degree | 527 | 5340 | 15651 | |
Total Housing Units | 1,489 | 13,128 | 45,201 | |
--Owner-Occupied | 1,374 | 11,581 | 36,185 | |
--Renter-Occupied | 72 | 923 | 7,029 | |
Owner-Occupied Values | < 100K | 2 | 94 | 1303 |
100-199K | 152 | 1649 | 7705 | |
200-299K | 561 | 3370 | 10618 | |
300-399K | 379 | 2709 | 8204 | |
400-499K | 102 | 1491 | 3580 | |
500K+ | 179 | 2269 | 4775 | |
Total Working Age Population | 3,335 | 28,999 | 98,115 | |
In Work Force | 2,047 | 18,799 | 65,856 | |
Not In Work Force | 1,288 | 10,200 | 32,259 | |
Workforce Employed | 1,948 | 18,016 | 63,311 | |
Workforce Unemployed | 95 | 725 | 2,352 | |
Civlian Workforce | 2,043 | 18,741 | 65,662 | |
Military Workforce | 4 | 59 | 194 | |
Total Households | 1,447 | 12,504 | 43,214 | |
Family Households | 1,148 | 10,608 | 34,830 | |
Non-Family Households | 299 | 1,897 | 8,384 | |
Married Couple | 1,003 | 9,251 | 28,702 | |
Other Family | 145 | 1,357 | 6,128 | |
Married w/Child | 331 | 3,951 | 12,331 | |
Single Male w/Child | 7 | 210 | 535 | |
Single Female w/Child | 39 | 425 | 2,441 |
Population Change Last Two Decades - Plus Projection
2000 | % | 2010 | % | 2020 | % | 2030 | |
---|---|---|---|---|---|---|---|
Georgia | 8,186,453 | +18 | 9,687,653 | +12 | 10,833,472 | +13 | 12,292,423 |
Cobb County | 607,751 | +13 | 688,078 | +15 | 790,588 | +19 | 938,747 |
Paulding County | 81,678 | +74 | 142,324 | +21 | 172,542 | +21 | 208,525 |
Total Working Age Population:
Total Households:
Total Working Age Population:
Total Households:
Total Working Age Population:
Total Households: