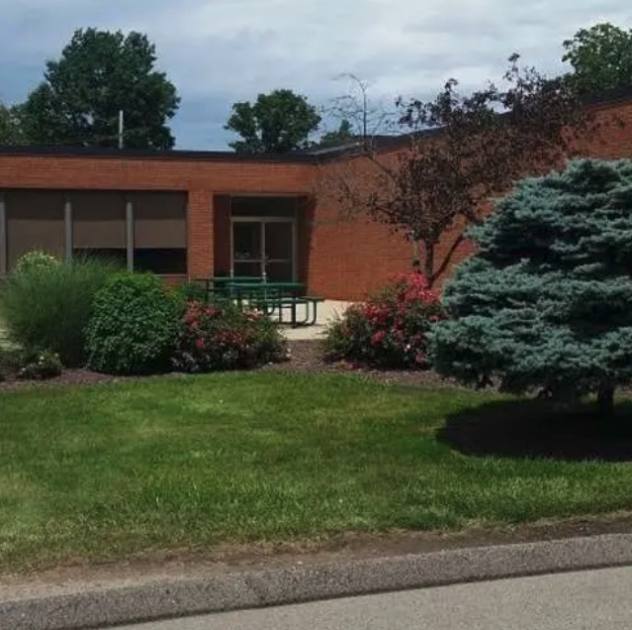
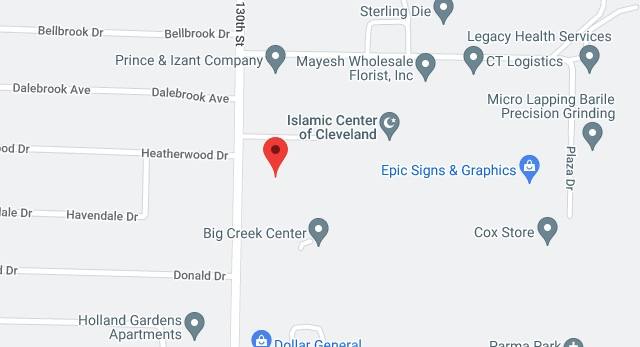
1-Mile | 3-Miles | 5-Miles | ||
---|---|---|---|---|
Total Population | 10,944 | 97,983 | 273,164 | |
Population Median Age | 42 | 41 | 40 | |
Population by Age | 0-9 Yrs | 1203 (10%) | 10709 (10%) | 29865 (10%) |
10-19 Yrs | 1144 (10%) | 11241 (11%) | 32593 (11%) | |
20-29 Yrs | 1606 (14%) | 13429 (13%) | 37397 (13%) | |
30-39 Yrs | 1306 (11%) | 11788 (12%) | 35363 (12%) | |
40-49 Yrs | 1066 (9%) | 11651 (11%) | 32270 (11%) | |
50-59 Yrs | 1556 (14%) | 13911 (14%) | 40137 (14%) | |
60-69 Yrs | 1346 (12%) | 11691 (11%) | 33111 (12%) | |
70+ Yrs | 1717 (15%) | 13562 (13%) | 32428 (11%) | |
Median HH Income | $54,716 | $51,897 | $51,542 | |
Total Household Income | < 24K | 835 (17%) | 9505 (22%) | 25854 (22%) |
25-49K | 1262 (26%) | 10879 (25%) | 30604 (26%) | |
50-74K | 1053 (22%) | 9167 (21%) | 23640 (20%) | |
75-99K | 690 (14%) | 5540 (13%) | 15351 (13%) | |
100-199K | 790 (16%) | 6449 (15%) | 18180 (15%) | |
200K+ | 55 (1%) | 747 (1%) | 2454 (2%) | |
Highest Education Level | No Diploma | 837 | 7339 | 22428 |
Diploma or GED | 2925 | 25783 | 66359 | |
Some College | 1819 | 15949 | 43206 | |
Assoc. Degree | 832 | 6391 | 16666 | |
Bachelors Degree | 948 | 9875 | 30104 | |
Higher Degree | 434 | 4397 | 14490 | |
Total Housing Units | 4,930 | 44,840 | 125,254 | |
--Owner-Occupied | 3,084 | 28,132 | 74,569 | |
--Renter-Occupied | 1,601 | 14,155 | 41,514 | |
Owner-Occupied Values | < 100K | 646 | 9757 | 29164 |
100-199K | 2257 | 16810 | 38402 | |
200-299K | 163 | 1238 | 5299 | |
300-399K | 19 | 211 | 1144 | |
400-499K | 0 | 33 | 180 | |
500K+ | 1 | 82 | 380 | |
Total Working Age Population | 9,038 | 80,597 | 224,601 | |
In Work Force | 5,733 | 51,847 | 145,820 | |
Not In Work Force | 3,305 | 28,750 | 78,781 | |
Workforce Employed | 5,474 | 48,418 | 136,040 | |
Workforce Unemployed | 259 | 3,420 | 9,704 | |
Civlian Workforce | 5,733 | 51,838 | 145,744 | |
Military Workforce | 0 | 8 | 76 | |
Total Households | 4,686 | 42,287 | 116,083 | |
Family Households | 2,784 | 24,681 | 66,961 | |
Non-Family Households | 1,901 | 17,606 | 49,122 | |
Married Couple | 1,981 | 16,543 | 44,321 | |
Other Family | 803 | 8,138 | 22,640 | |
Married w/Child | 690 | 5,539 | 15,491 | |
Single Male w/Child | 89 | 1,011 | 2,789 | |
Single Female w/Child | 241 | 2,972 | 8,330 |
Population Change Last Two Decades - Plus Projection
2000 | % | 2010 | % | 2020 | % | 2030 | |
---|---|---|---|---|---|---|---|
Ohio | 11,353,140 | +2 | 11,536,504 | 0 | 11,574,870 | 0 | 11,615,100 |
Cuyahoga County | 1,393,978 | -8 | 1,280,122 | -6 | 1,209,550 | -5 | 1,154,210 |
Total Working Age Population:
Total Households:
Total Working Age Population:
Total Households:
Total Working Age Population:
Total Households: