Office Space
148 East Miller Avenue Akron, OH 44301
148 East Miller Avenue Akron, OH 44301

Details & Description
Property Highlights
- • Fully Leased 2-Story Office Building 6,070 SF
- • 23 Storage Units 7,071 SF
- • 1.396 Acres
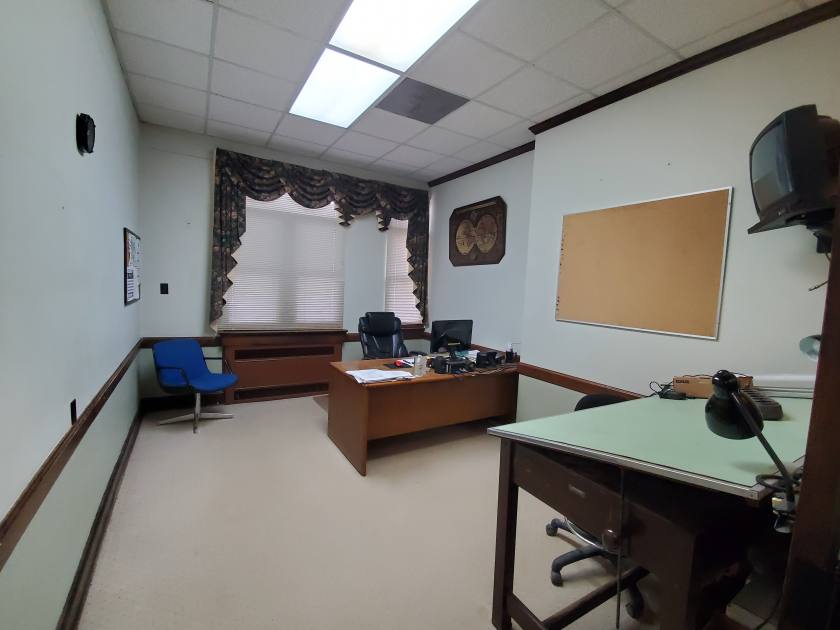
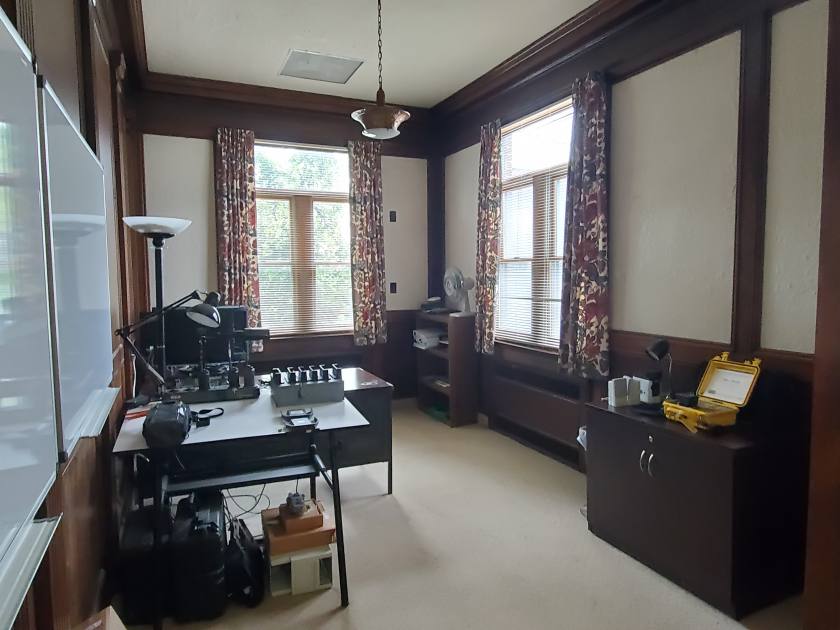
Additional Photos


Listing Agents

Bob Raskow
O: 303-535-2661
M: 330-697-6818
bob.raskow@naipvc.com
O: 303-535-2661
M: 330-697-6818
bob.raskow@naipvc.com

Scott Raskow
O: 330-535-2661
M: 330-608-5172
scott.raskow@naipvc.com
O: 330-535-2661
M: 330-608-5172
scott.raskow@naipvc.com
While we strive to provide the most accurate information, all listing information, and demographic data, is provided by third-parties. As such, MyEListing will not be responsible for the accuracy of the information. It is strongly recommended that you verify all information with the listing agent, and any relevant agencies, prior to making any decisions.