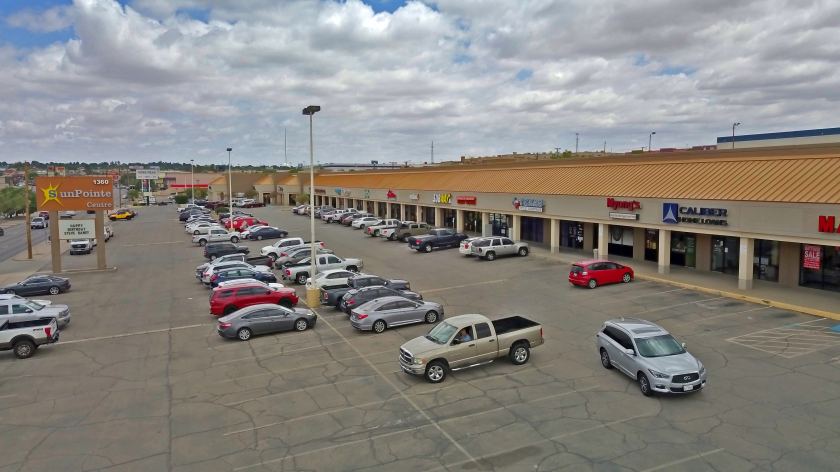
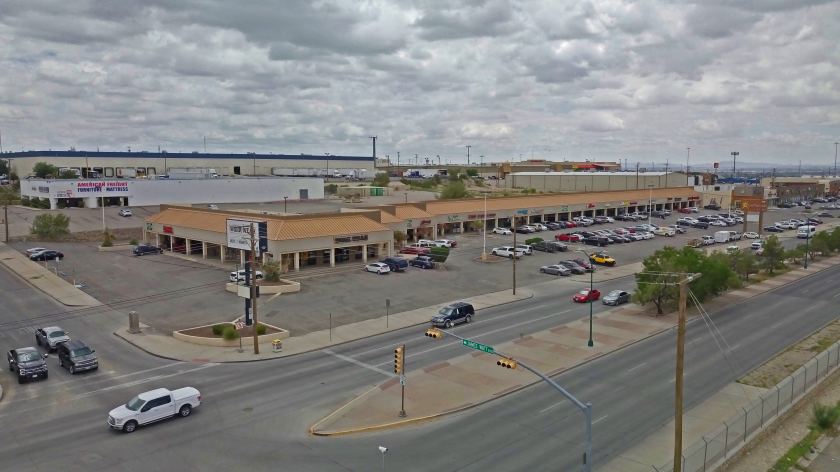
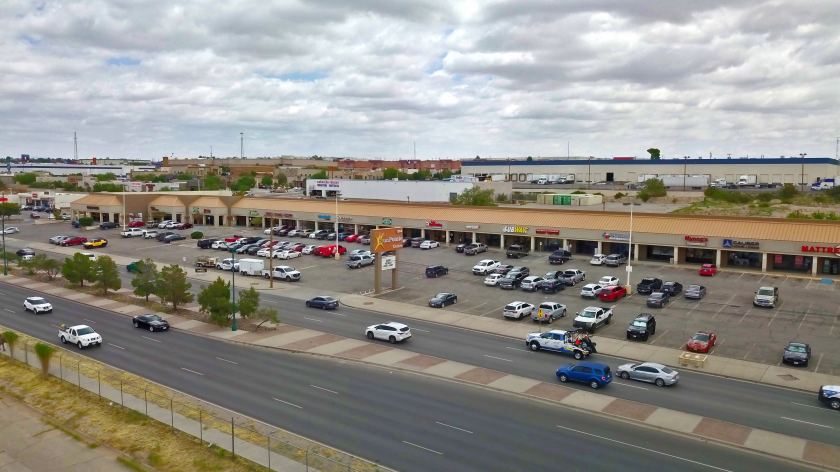
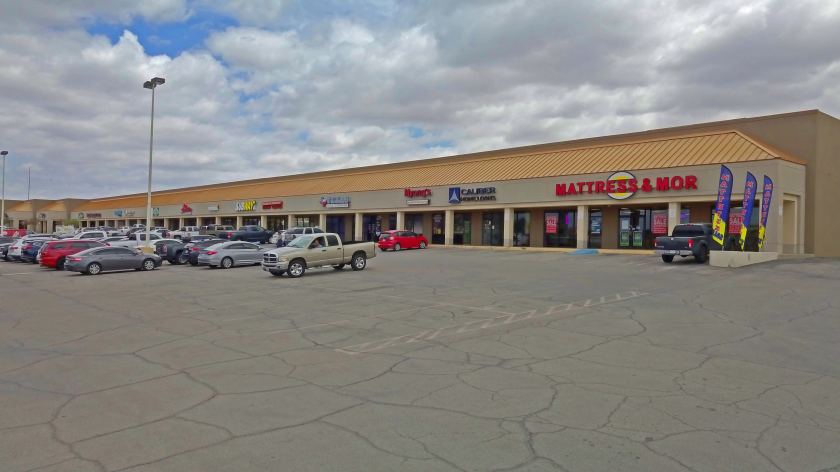
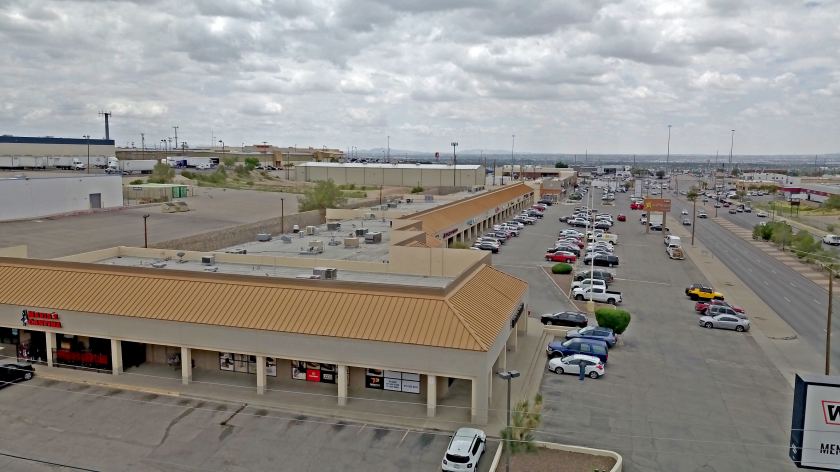
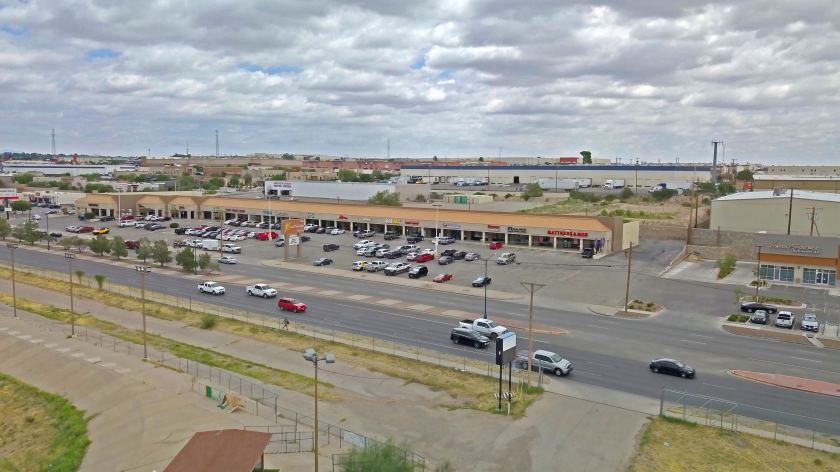
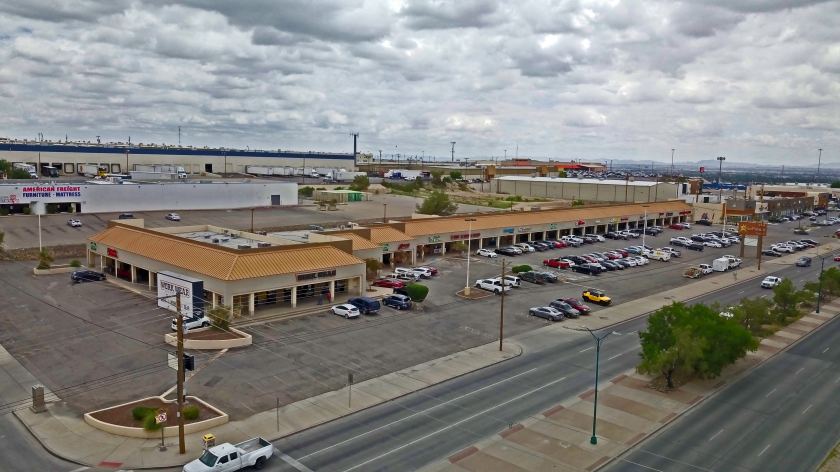
1-Mile | 3-Miles | 5-Miles | ||
---|---|---|---|---|
Total Population | 8,959 | 140,296 | 282,195 | |
Population Median Age | 38 | 37 | 36 | |
Population by Age | 0-9 Yrs | 953 (10%) | 17499 (12%) | 36749 (13%) |
10-19 Yrs | 1430 (15%) | 20812 (14%) | 44727 (15%) | |
20-29 Yrs | 1639 (18%) | 23835 (16%) | 46713 (16%) | |
30-39 Yrs | 1066 (11%) | 15874 (11%) | 32311 (11%) | |
40-49 Yrs | 986 (11%) | 16048 (11%) | 35142 (12%) | |
50-59 Yrs | 872 (9%) | 17903 (12%) | 34072 (12%) | |
60-69 Yrs | 1077 (12%) | 13934 (9%) | 26584 (9%) | |
70+ Yrs | 935 (10%) | 14391 (10%) | 25898 (9%) | |
Median HH Income | $45,797 | $45,588 | $46,837 | |
Total Household Income | < 24K | 946 (28%) | 12735 (27%) | 23140 (25%) |
25-49K | 915 (27%) | 12795 (27%) | 25324 (27%) | |
50-74K | 650 (19%) | 9376 (19%) | 18503 (20%) | |
75-99K | 298 (8%) | 4902 (10%) | 10115 (11%) | |
100-199K | 482 (14%) | 6207 (13%) | 12342 (13%) | |
200K+ | 57 (1%) | 981 (2%) | 1793 (1%) | |
Highest Education Level | No Diploma | 920 | 17872 | 36526 |
Diploma or GED | 1543 | 24123 | 45201 | |
Some College | 1580 | 22316 | 43823 | |
Assoc. Degree | 469 | 7584 | 14405 | |
Bachelors Degree | 856 | 13084 | 25656 | |
Higher Degree | 380 | 4661 | 9756 | |
Total Housing Units | 3,531 | 50,233 | 97,714 | |
--Owner-Occupied | 1,696 | 27,469 | 56,478 | |
--Renter-Occupied | 1,651 | 19,526 | 34,739 | |
Owner-Occupied Values | < 100K | 539 | 8488 | 18411 |
100-199K | 966 | 15726 | 31690 | |
200-299K | 113 | 2345 | 4540 | |
300-399K | 43 | 569 | 1142 | |
400-499K | 4 | 56 | 127 | |
500K+ | 31 | 285 | 569 | |
Total Working Age Population | 7,073 | 110,252 | 218,776 | |
In Work Force | 4,305 | 67,963 | 135,585 | |
Not In Work Force | 2,768 | 42,290 | 83,190 | |
Workforce Employed | 3,932 | 63,266 | 124,293 | |
Workforce Unemployed | 270 | 3,648 | 7,718 | |
Civlian Workforce | 4,202 | 66,914 | 132,011 | |
Military Workforce | 103 | 1,049 | 3,574 | |
Total Households | 3,347 | 46,995 | 91,217 | |
Family Households | 2,161 | 33,920 | 67,219 | |
Non-Family Households | 1,186 | 13,075 | 23,999 | |
Married Couple | 1,323 | 21,088 | 42,423 | |
Other Family | 839 | 12,833 | 24,796 | |
Married w/Child | 465 | 8,028 | 17,372 | |
Single Male w/Child | 83 | 1,017 | 2,318 | |
Single Female w/Child | 376 | 5,096 | 9,521 |
Population Change Last Two Decades - Plus Projection
2000 | % | 2010 | % | 2020 | % | 2030 | |
---|---|---|---|---|---|---|---|
Texas | 20,851,820 | +21 | 25,145,561 | +18 | 29,677,668 | +18 | 34,894,452 |
El Paso County | 679,622 | +18 | 800,647 | +9 | 876,120 | +7 | 936,697 |
Total Working Age Population:
Total Households:
Total Working Age Population:
Total Households:
Total Working Age Population:
Total Households: