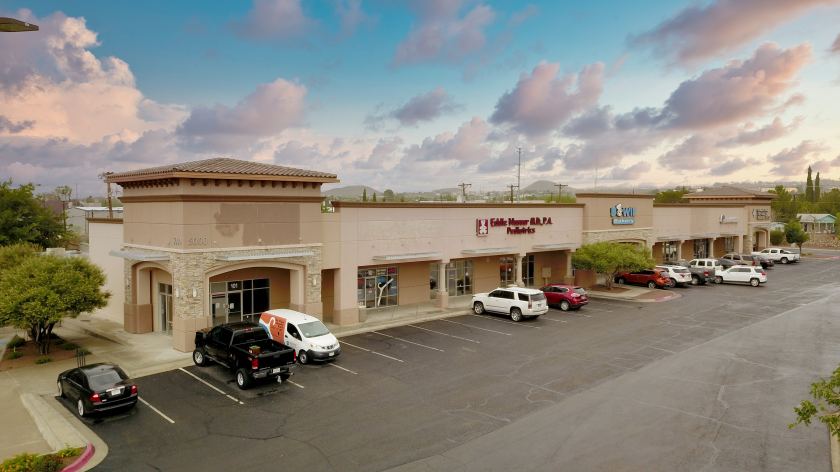
Retail Space
5000 Doniphan Drive, 101 El Paso, TX 79932
5000 Doniphan Drive, 101 El Paso, TX 79932
Details & Description
Property Highlights
• Great Visibility
• Great Visibility
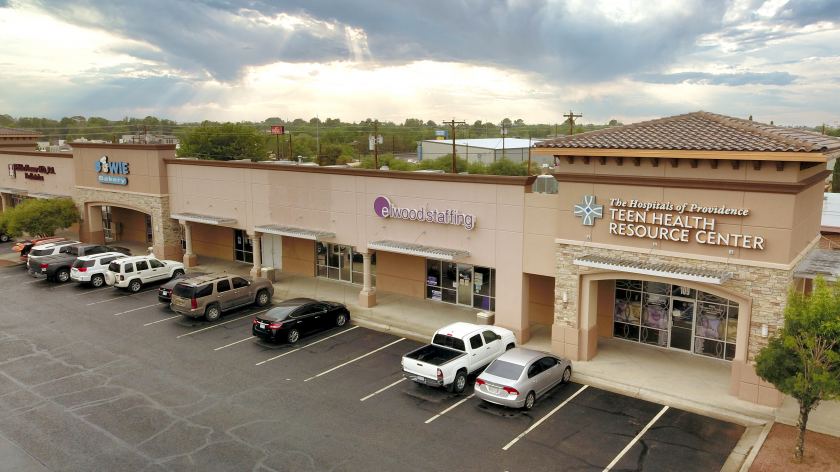
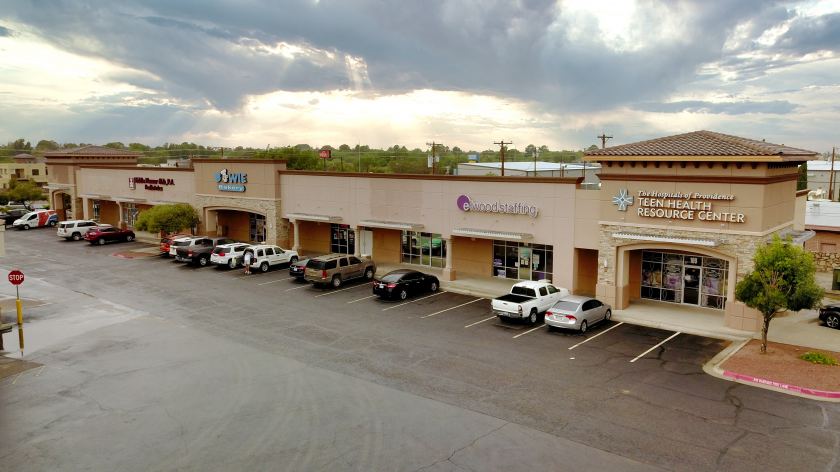
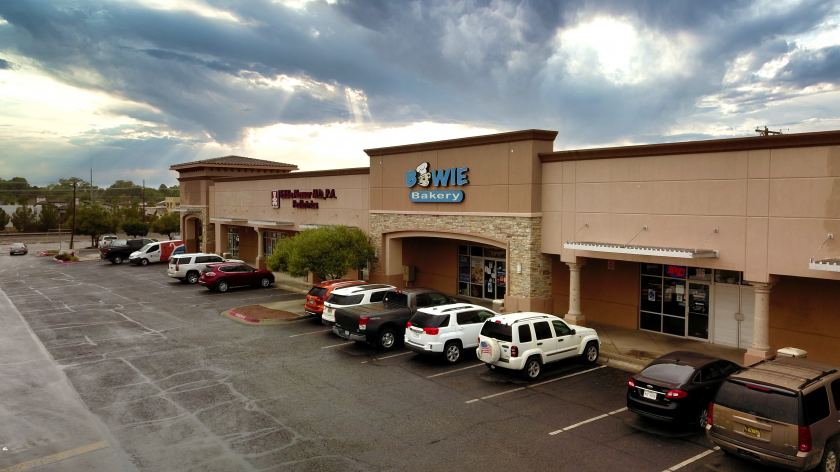
Additional Photos
Listing Agents

Gilles Dekoninck
O: 915-225-7713
M: 304-972-1503
gdekoninck@ropelpaso.com
O: 915-225-7713
M: 304-972-1503
gdekoninck@ropelpaso.com
While we strive to provide the most accurate information, all listing information, and demographic data, is provided by third-parties. As such, MyEListing will not be responsible for the accuracy of the information. It is strongly recommended that you verify all information with the listing agent, and any relevant agencies, prior to making any decisions.


