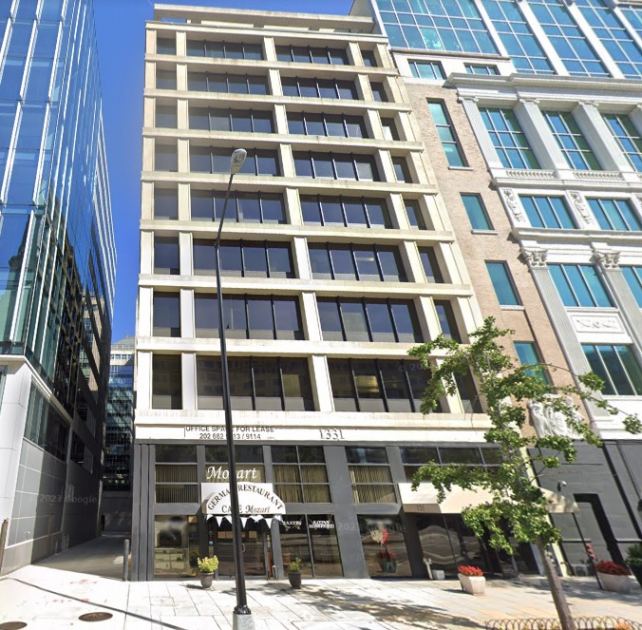
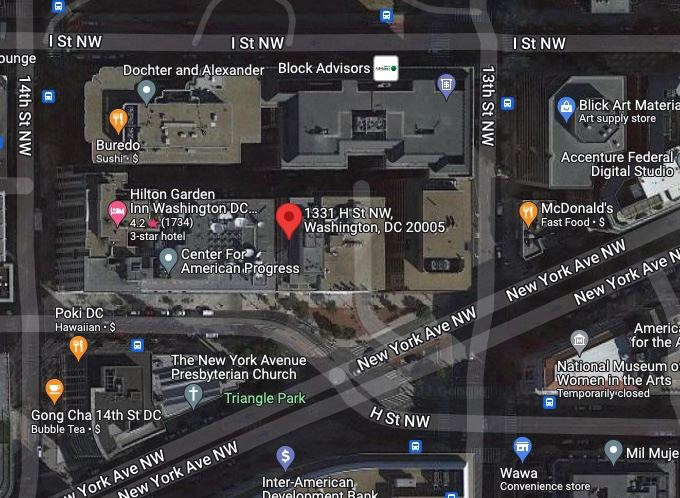
1-Mile | 3-Miles | 5-Miles | ||
---|---|---|---|---|
Total Population | 52,563 | 375,929 | 824,034 | |
Population Median Age | 36 | 36 | 37 | |
Population by Age | 0-9 Yrs | 2696 (5%) | 30333 (8%) | 89225 (10%) |
10-19 Yrs | 4054 (7%) | 26345 (7%) | 70823 (8%) | |
20-29 Yrs | 15079 (28%) | 97499 (25%) | 173039 (20%) | |
30-39 Yrs | 13964 (26%) | 92616 (24%) | 173207 (21%) | |
40-49 Yrs | 5448 (10%) | 42336 (11%) | 99520 (12%) | |
50-59 Yrs | 4923 (9%) | 34602 (9%) | 86745 (10%) | |
60-69 Yrs | 3576 (6%) | 27690 (7%) | 68869 (8%) | |
70+ Yrs | 2823 (5%) | 24508 (6%) | 62606 (7%) | |
Median HH Income | $106,251 | $107,591 | $96,344 | |
Total Household Income | < 24K | 4071 (14%) | 24011 (14%) | 55985 (15%) |
25-49K | 3098 (11%) | 17188 (10%) | 42864 (12%) | |
50-74K | 2910 (10%) | 19275 (11%) | 43845 (12%) | |
75-99K | 2989 (10%) | 19463 (11%) | 39654 (11%) | |
100-199K | 9274 (33%) | 55026 (32%) | 103501 (29%) | |
200K+ | 5360 (19%) | 36544 (21%) | 67254 (19%) | |
Highest Education Level | No Diploma | 2353 | 19195 | 50178 |
Diploma or GED | 3475 | 26211 | 82117 | |
Some College | 2615 | 21837 | 66189 | |
Assoc. Degree | 757 | 6372 | 17788 | |
Bachelors Degree | 12097 | 88513 | 166779 | |
Higher Degree | 18822 | 120703 | 215031 | |
Total Housing Units | 30,667 | 190,845 | 388,659 | |
--Owner-Occupied | 7,873 | 63,545 | 139,316 | |
--Renter-Occupied | 19,829 | 107,961 | 213,786 | |
Owner-Occupied Values | < 100K | 153 | 879 | 2379 |
100-199K | 79 | 893 | 3200 | |
200-299K | 506 | 3378 | 11535 | |
300-399K | 1015 | 7320 | 17896 | |
400-499K | 1293 | 7327 | 17478 | |
500K+ | 4827 | 43749 | 86827 | |
Total Working Age Population | 49,227 | 335,084 | 698,211 | |
In Work Force | 37,626 | 256,083 | 510,971 | |
Not In Work Force | 11,601 | 79,001 | 187,240 | |
Workforce Employed | 35,929 | 242,789 | 476,525 | |
Workforce Unemployed | 1,423 | 10,937 | 27,345 | |
Civlian Workforce | 37,352 | 253,725 | 503,870 | |
Military Workforce | 275 | 2,358 | 7,101 | |
Total Households | 27,702 | 171,507 | 353,101 | |
Family Households | 6,333 | 58,001 | 147,898 | |
Non-Family Households | 21,369 | 113,506 | 205,203 | |
Married Couple | 4,949 | 42,386 | 98,797 | |
Other Family | 1,384 | 15,615 | 49,102 | |
Married w/Child | 1,035 | 13,386 | 37,753 | |
Single Male w/Child | 133 | 1,347 | 4,549 | |
Single Female w/Child | 512 | 5,607 | 18,117 |
Population Change Last Two Decades - Plus Projection
2000 | % | 2010 | % | 2020 | % | 2030 | |
---|---|---|---|---|---|---|---|
District of Columbia | 572,059 | +5 | 601,723 | +21 | 729,501 | +15 | 842,154 |
Maryland | 5,296,486 | +9 | 5,773,552 | +6 | 6,141,900 | +6 | 6,518,750 |
Montgomery County | 873,341 | +11 | 971,777 | +8 | 1,052,050 | +7 | 1,128,800 |
Prince Georges County | 801,515 | +8 | 863,420 | +6 | 916,150 | +4 | 952,950 |
Virginia | 7,078,515 | +13 | 8,001,024 | +8 | 8,655,021 | +8 | 9,331,666 |
Arlington County | 189,453 | +10 | 207,627 | +20 | 249,298 | +10 | 274,339 |
Alexandria city | 128,283 | +9 | 139,966 | +19 | 166,261 | +10 | 182,067 |
Total Working Age Population:
Total Households:
Total Working Age Population:
Total Households:
Total Working Age Population:
Total Households: