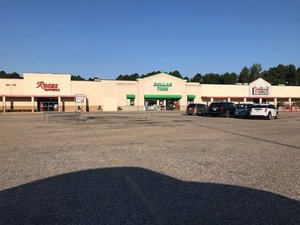
1-Mile | 3-Miles | 5-Miles | ||
---|---|---|---|---|
Total Population | 1,788 | 9,552 | 12,521 | |
Population Median Age | 40 | 40 | 41 | |
Population by Age | 0-9 Yrs | 252 (14%) | 1426 (14%) | 1768 (14%) |
10-19 Yrs | 187 (10%) | 972 (10%) | 1260 (10%) | |
20-29 Yrs | 178 (9%) | 1047 (10%) | 1400 (11%) | |
30-39 Yrs | 320 (17%) | 1253 (13%) | 1516 (12%) | |
40-49 Yrs | 176 (9%) | 1031 (10%) | 1393 (11%) | |
50-59 Yrs | 221 (12%) | 1172 (12%) | 1591 (12%) | |
60-69 Yrs | 262 (14%) | 1532 (16%) | 2084 (16%) | |
70+ Yrs | 192 (10%) | 1119 (11%) | 1510 (12%) | |
Median HH Income | $45,335 | $45,153 | $47,323 | |
Total Household Income | < 24K | 285 (33%) | 1235 (30%) | 1439 (27%) |
25-49K | 221 (26%) | 1127 (27%) | 1426 (26%) | |
50-74K | 156 (18%) | 768 (18%) | 1025 (19%) | |
75-99K | 98 (11%) | 391 (9%) | 628 (11%) | |
100-199K | 72 (8%) | 534 (12%) | 722 (13%) | |
200K+ | 13 (1%) | 56 (1%) | 85 (1%) | |
Highest Education Level | No Diploma | 207 | 897 | 1224 |
Diploma or GED | 292 | 2034 | 2708 | |
Some College | 370 | 1648 | 2211 | |
Assoc. Degree | 183 | 975 | 1208 | |
Bachelors Degree | 137 | 805 | 1039 | |
Higher Degree | 101 | 455 | 558 | |
Total Housing Units | 945 | 4,496 | 5,837 | |
--Owner-Occupied | 324 | 2,314 | 3,238 | |
--Renter-Occupied | 521 | 1,797 | 2,088 | |
Owner-Occupied Values | < 100K | 122 | 494 | 693 |
100-199K | 73 | 949 | 1268 | |
200-299K | 109 | 753 | 1046 | |
300-399K | 19 | 103 | 178 | |
400-499K | 0 | 3 | 24 | |
500K+ | 1 | 12 | 29 | |
Total Working Age Population | 1,380 | 7,351 | 9,778 | |
In Work Force | 951 | 4,704 | 6,118 | |
Not In Work Force | 429 | 2,647 | 3,660 | |
Workforce Employed | 872 | 4,131 | 5,448 | |
Workforce Unemployed | 79 | 571 | 651 | |
Civlian Workforce | 951 | 4,702 | 6,099 | |
Military Workforce | 0 | 2 | 19 | |
Total Households | 845 | 4,111 | 5,326 | |
Family Households | 478 | 2,604 | 3,505 | |
Non-Family Households | 366 | 1,507 | 1,821 | |
Married Couple | 288 | 1,566 | 2,177 | |
Other Family | 190 | 1,037 | 1,328 | |
Married w/Child | 79 | 440 | 576 | |
Single Male w/Child | 2 | 34 | 64 | |
Single Female w/Child | 78 | 550 | 670 |
Population Change Last Two Decades - Plus Projection
2000 | % | 2010 | % | 2020 | % | 2030 | |
---|---|---|---|---|---|---|---|
Virginia | 7,078,515 | +13 | 8,001,024 | +8 | 8,655,021 | +8 | 9,331,666 |
Isle of Wight County | 29,728 | +19 | 35,270 | +8 | 38,060 | +10 | 41,823 |
Southampton County | 17,482 | +6 | 18,570 | -4 | 17,739 | 0 | 17,711 |
Franklin city | 8,346 | +3 | 8,582 | -4 | 8,268 | -2 | 8,140 |
Suffolk city | 63,677 | +33 | 84,585 | +12 | 94,733 | +16 | 109,424 |
Total Working Age Population:
Total Households:
Total Working Age Population:
Total Households:
Total Working Age Population:
Total Households: