Retail Space
1000 West Temple Street Los Angeles, CA 90012
1000 West Temple Street Los Angeles, CA 90012
Details & Description
Property Highlights
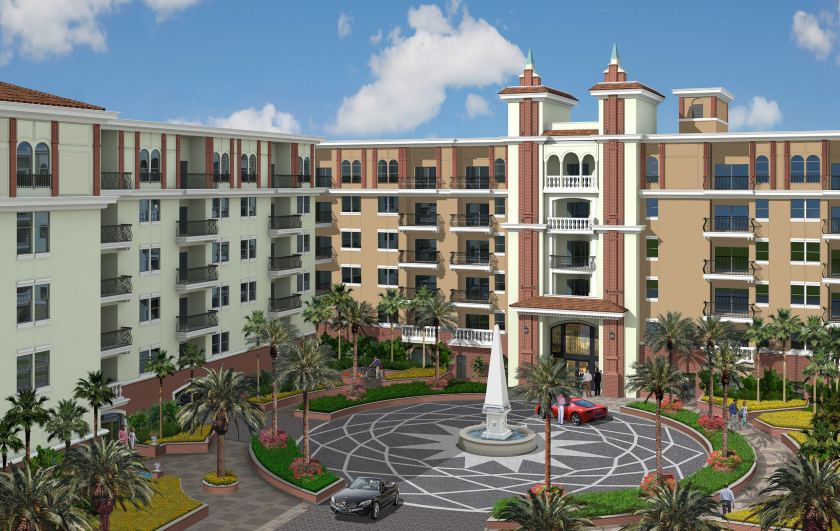
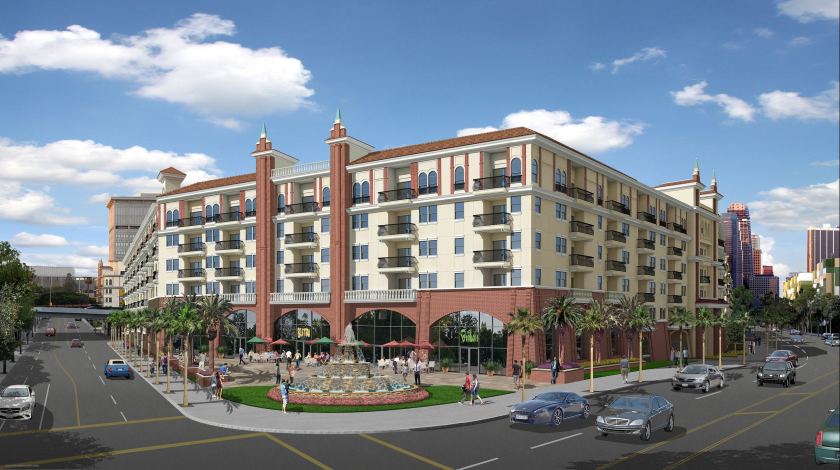
• The Ferrante, a Mediterranean inspired mixed-use project by GH Palmer boasts 1,150 apartments with a combined 21,250 sq.
• Highly visible ground level street facing units ranging from 1,568 sq. ft. 19,685 sq. ft. with an anticipated 2021
Listing Agents

Yansy Naranjo
O: 213-471-7323
yansy.naranjo@avisonyoung.com
O: 213-471-7323
yansy.naranjo@avisonyoung.com
While we strive to provide the most accurate information, all listing information, and demographic data, is provided by third-parties. As such, MyEListing will not be responsible for the accuracy of the information. It is strongly recommended that you verify all information with the listing agent, and any relevant agencies, prior to making any decisions.