Retail Space
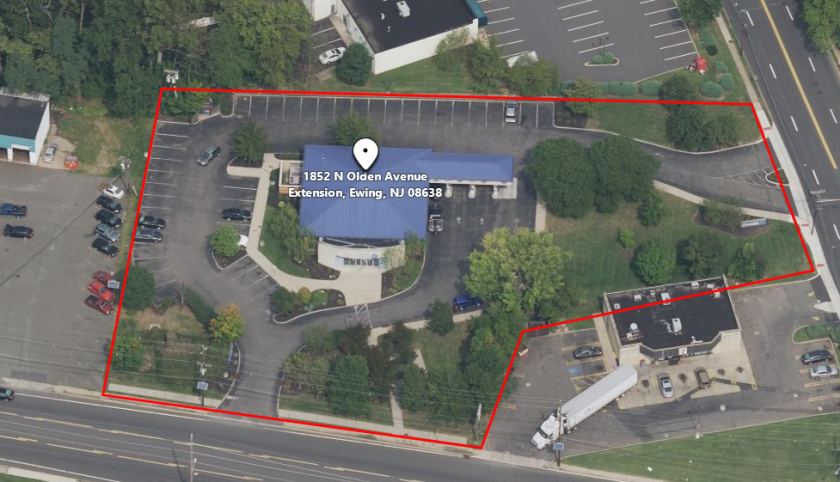
1852 North Olden Extended Ewing Township, NJ 08638
1852 North Olden Extended Ewing Township, NJ 08638

Details & Description
Property Highlights
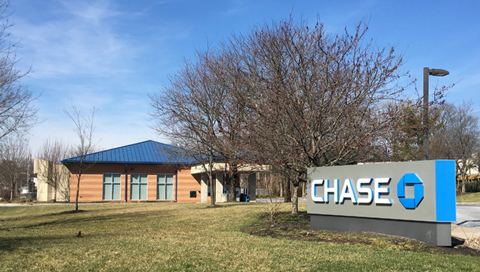
• Former Bank Site
• Former Bank Site
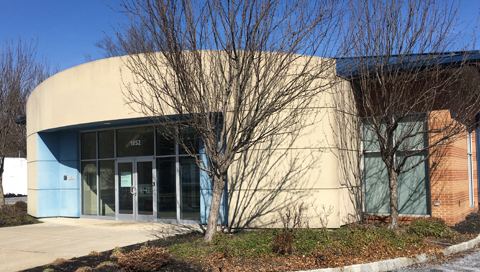
Additional Photos


Listing Agents

Scott Savastano
O: 973-379-6644
M: 973-464-3800
sgsavastano@blauberg.com
O: 973-379-6644
M: 973-464-3800
sgsavastano@blauberg.com
While we strive to provide the most accurate information, all listing information, and demographic data, is provided by third-parties. As such, MyEListing will not be responsible for the accuracy of the information. It is strongly recommended that you verify all information with the listing agent, and any relevant agencies, prior to making any decisions.