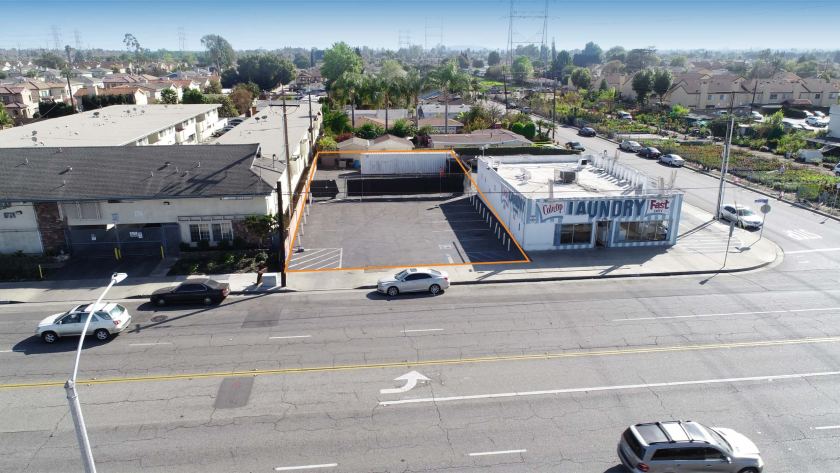
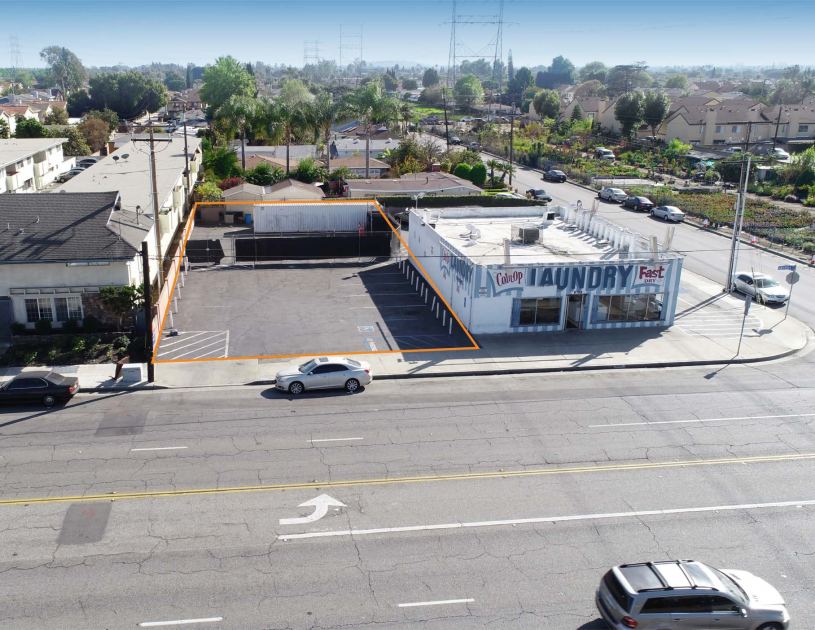
Flex-Office-Warehouse
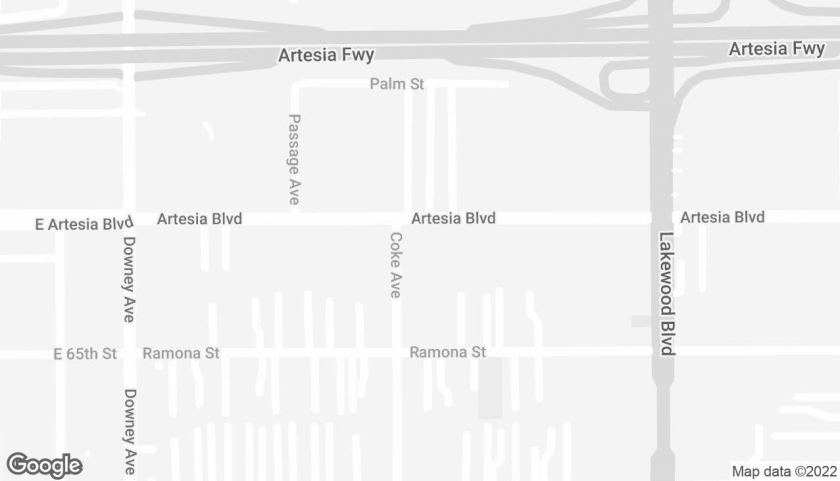
8710 Artesia Boulevard Bellflower, CA 90706
8710 Artesia Boulevard Bellflower, CA 90706
Details & Description
Property Highlights
• Great location, one block from signalized intersection at Artesia Lakewood 67,000 VPD
• Local tenants include Starbucks, Stater Bros., Planet Fitness, Dennys, and more
Listing Agents

Lorenzo Bonina
O: 714-446-0600
M: 714-829-9205
lorenzo.bonina@svn.com
O: 714-446-0600
M: 714-829-9205
lorenzo.bonina@svn.com
While we strive to provide the most accurate information, all listing information, and demographic data, is provided by third-parties. As such, MyEListing will not be responsible for the accuracy of the information. It is strongly recommended that you verify all information with the listing agent, and any relevant agencies, prior to making any decisions.