Retail Space
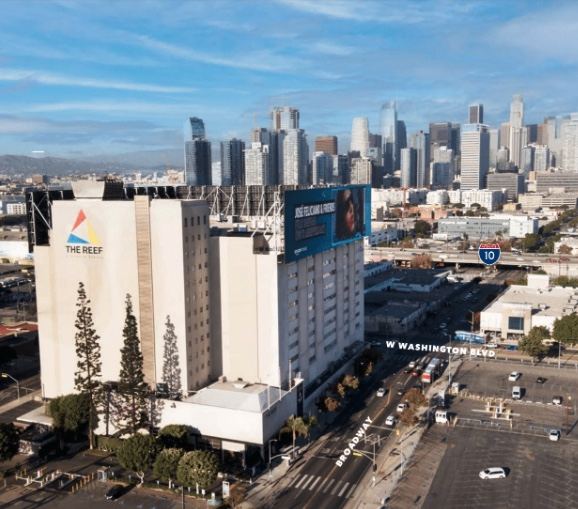
1933 South Broadway Los Angeles, CA 90007
1933 South Broadway Los Angeles, CA 90007
Details & Description
Property Highlights
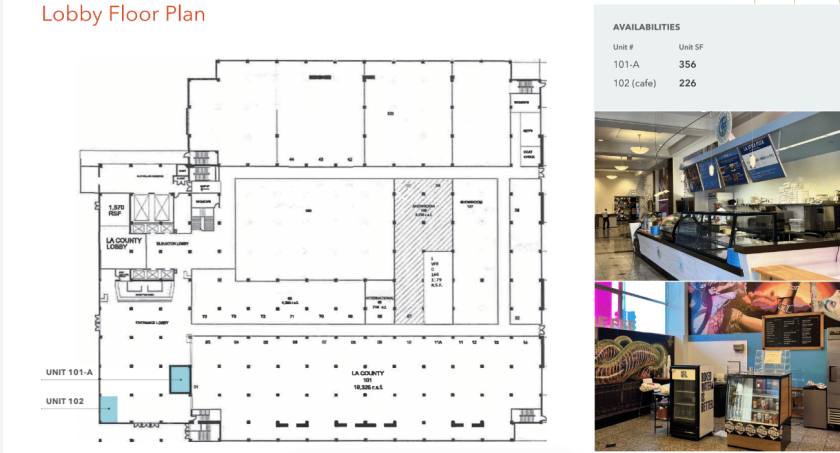
• Self-Contained environment with multiple on-site amenities that include food service a coffee bar
• Considerable on-site single stall parking with over 1,100 parking spaces.
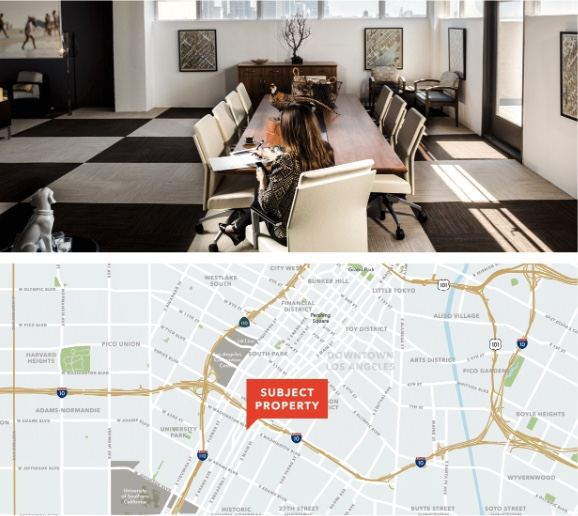
Additional Photos
Listing Agents

John Anthony
O: 213-225-7218
M: 213-507-5570
john.anthony@kidder.com
O: 213-225-7218
M: 213-507-5570
john.anthony@kidder.com

Christopher Steck
O: 213-225-7231
christopher.steck@kidder.com
O: 213-225-7231
christopher.steck@kidder.com

Christopher Giordano
Kidder Mathews
O: 213-225-7219
christopher.giordano@kidder.com
Kidder Mathews
O: 213-225-7219
christopher.giordano@kidder.com
While we strive to provide the most accurate information, all listing information, and demographic data, is provided by third-parties. As such, MyEListing will not be responsible for the accuracy of the information. It is strongly recommended that you verify all information with the listing agent, and any relevant agencies, prior to making any decisions.


