Office Space
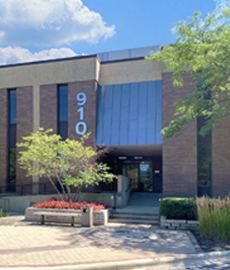
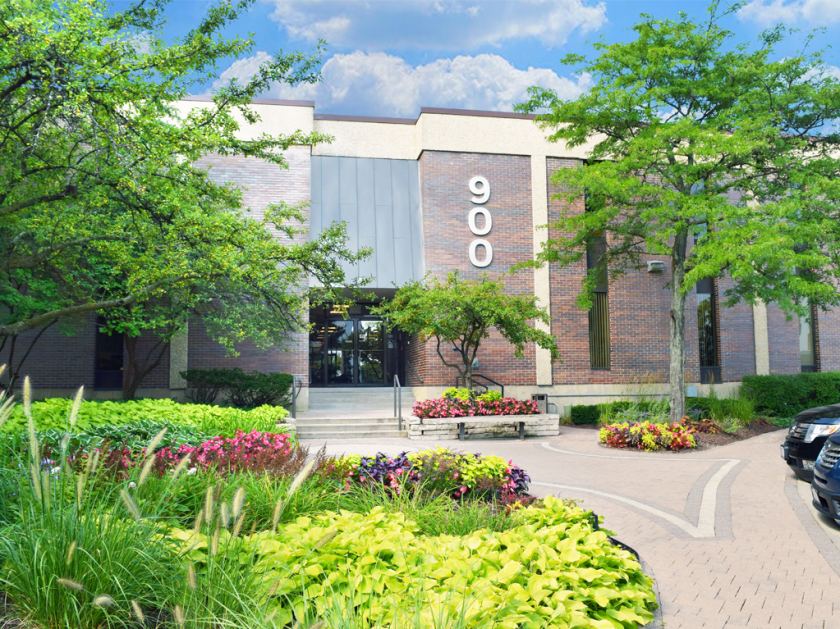
900 Skokie Boulevard Northbrook, IL 60062
900 Skokie Boulevard Northbrook, IL 60062
Details & Description
Property Highlights
• Near the intersection of Dundee and Skokie Boulevard. with immediate access to Edens expressway
• Public transportation nearby
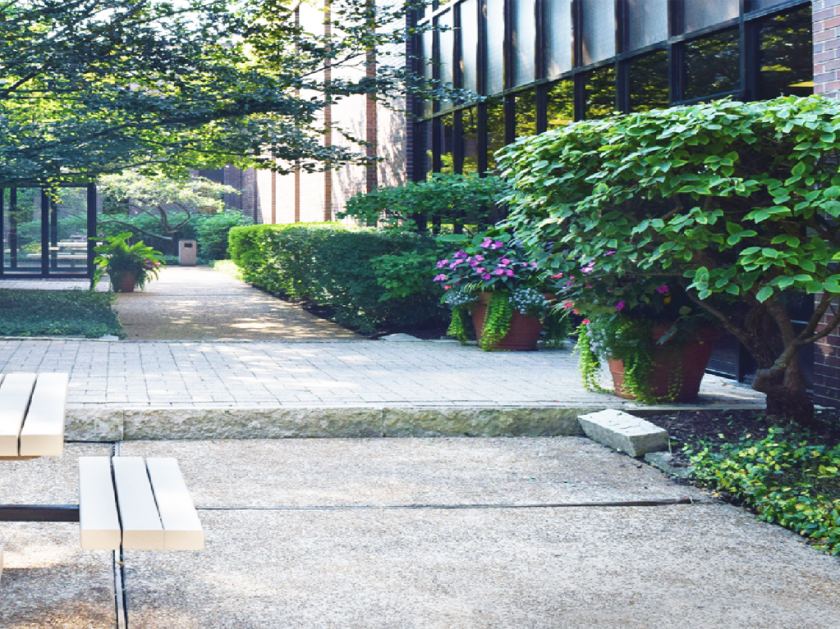
Additional Photos

Listing Agents

Alan Raphaeli
O: 847-330-1300
araphaeli@marcrealty.com
O: 847-330-1300
araphaeli@marcrealty.com
While we strive to provide the most accurate information, all listing information, and demographic data, is provided by third-parties. As such, MyEListing will not be responsible for the accuracy of the information. It is strongly recommended that you verify all information with the listing agent, and any relevant agencies, prior to making any decisions.


