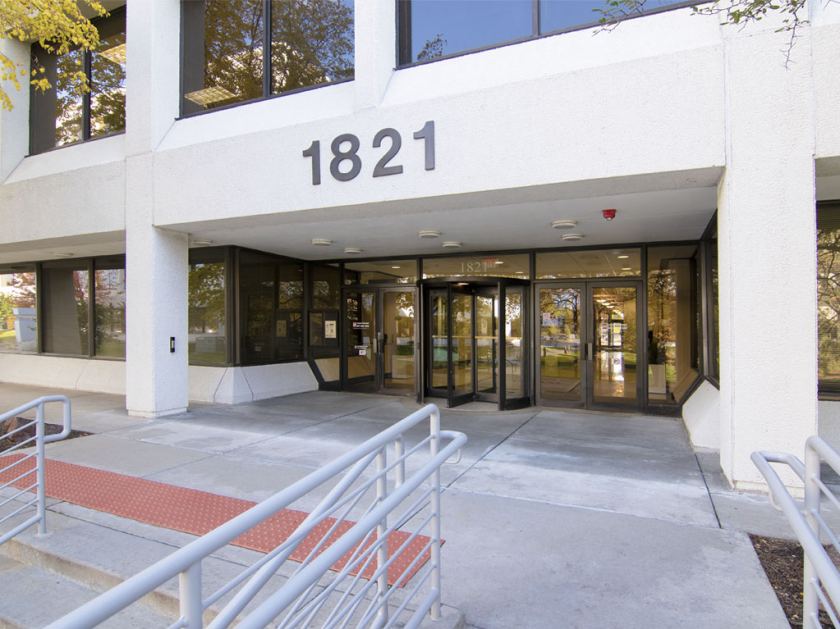
Office Space
1821 Walden Office Square Schaumburg, IL 60173
1821 Walden Office Square Schaumburg, IL 60173

Details & Description
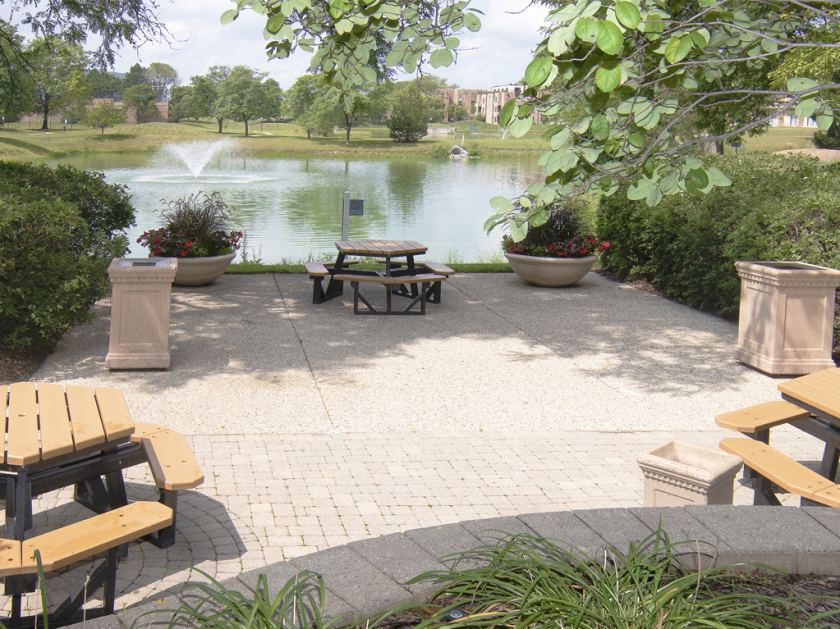
Property Highlights
• Walking distance to major hotels and restaurants
• Adjacent to Schaumburg Convention Center
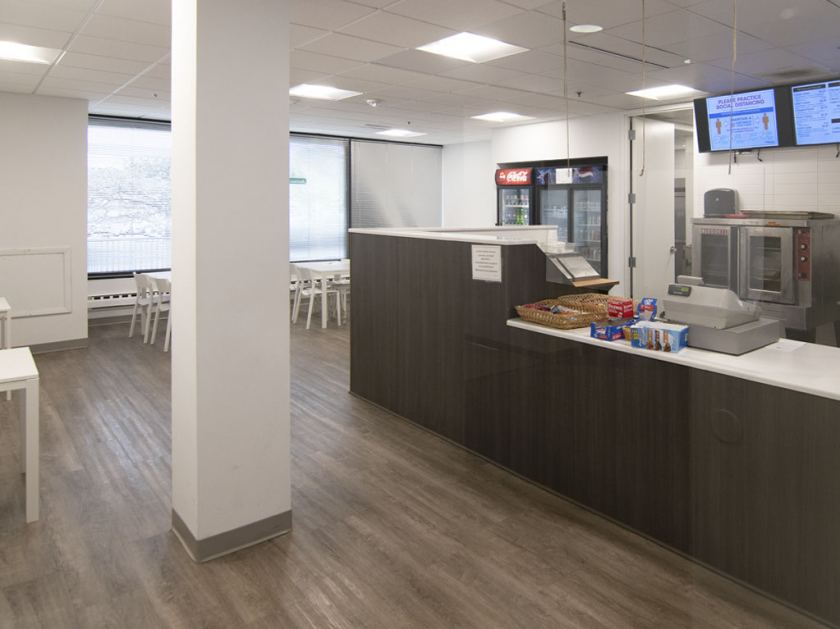
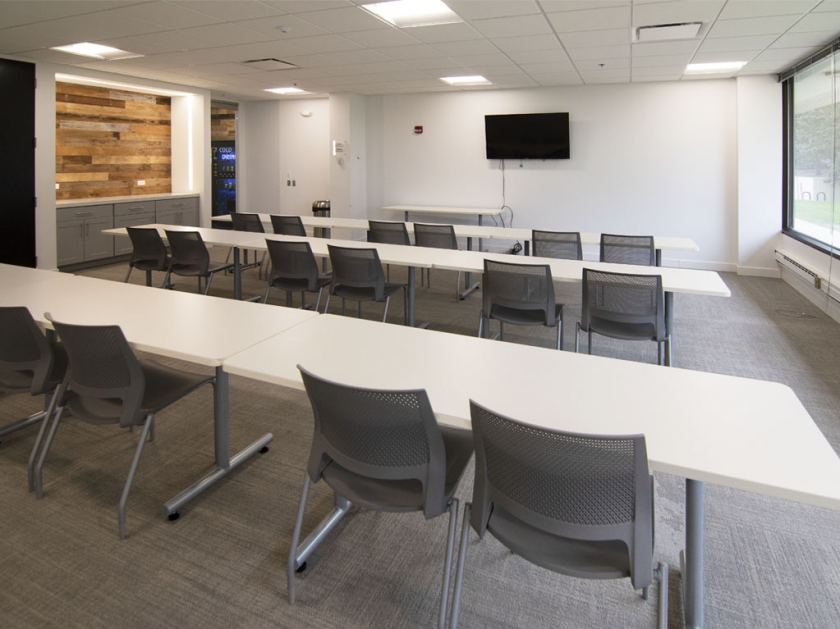
Additional Photos
Listing Agents

Yasmin Aurora
O: 847-330-1300
yaurora@marcrealty.com
O: 847-330-1300
yaurora@marcrealty.com
While we strive to provide the most accurate information, all listing information, and demographic data, is provided by third-parties. As such, MyEListing will not be responsible for the accuracy of the information. It is strongly recommended that you verify all information with the listing agent, and any relevant agencies, prior to making any decisions.


