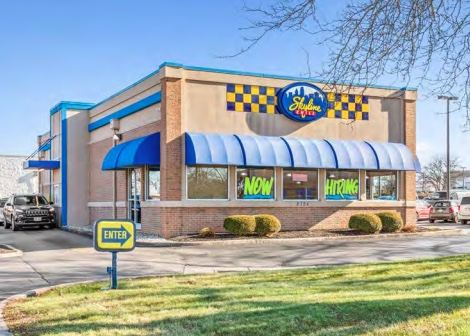
Retail Space
2800 Wilmington Pike Kettering, OH 45419
2800 Wilmington Pike Kettering, OH 45419

Details & Description
Property Highlights
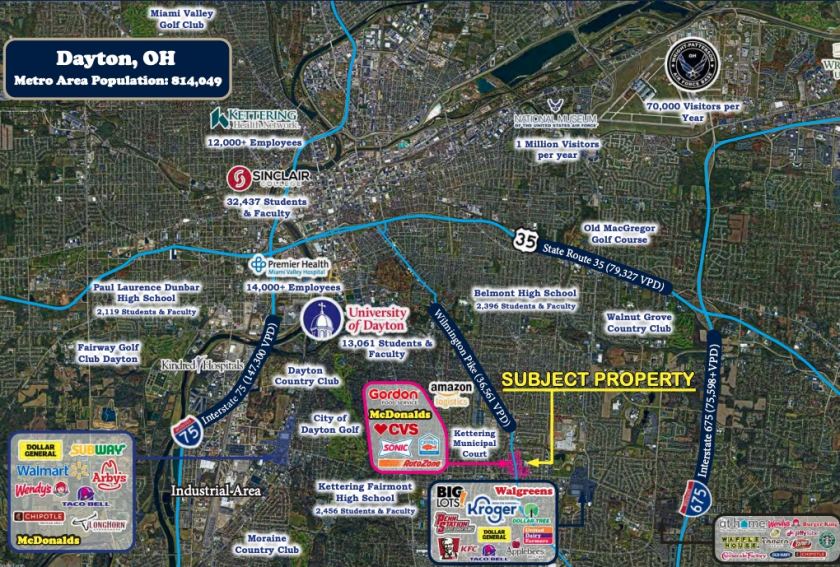
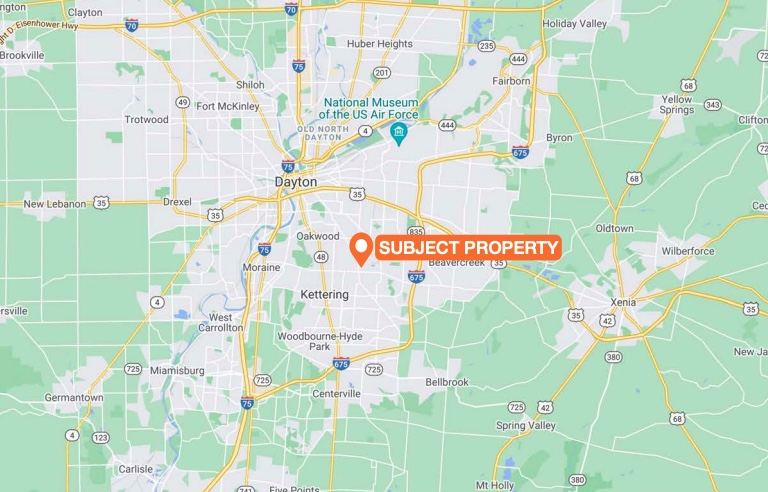
• Positioned 2.5 miles from I-675 with Over 68,800 VPD and Less than 5 miles from downtown Dayton
• Tenant is Completing a Full Interior Renovation and is Scheduled to Open in January of 2022
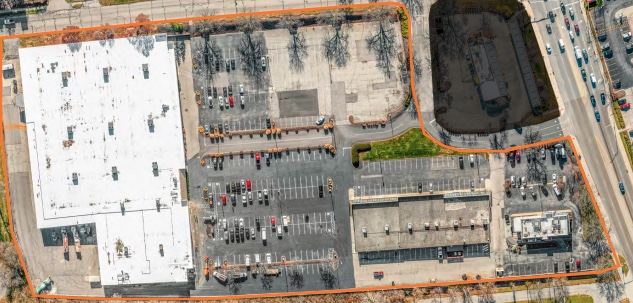
Additional Photos

Listing Agents

Frank Simcic
O: 813-387-4700
frank.simcic@marcusmillichap.com
O: 813-387-4700
frank.simcic@marcusmillichap.com
While we strive to provide the most accurate information, all listing information, and demographic data, is provided by third-parties. As such, MyEListing will not be responsible for the accuracy of the information. It is strongly recommended that you verify all information with the listing agent, and any relevant agencies, prior to making any decisions.