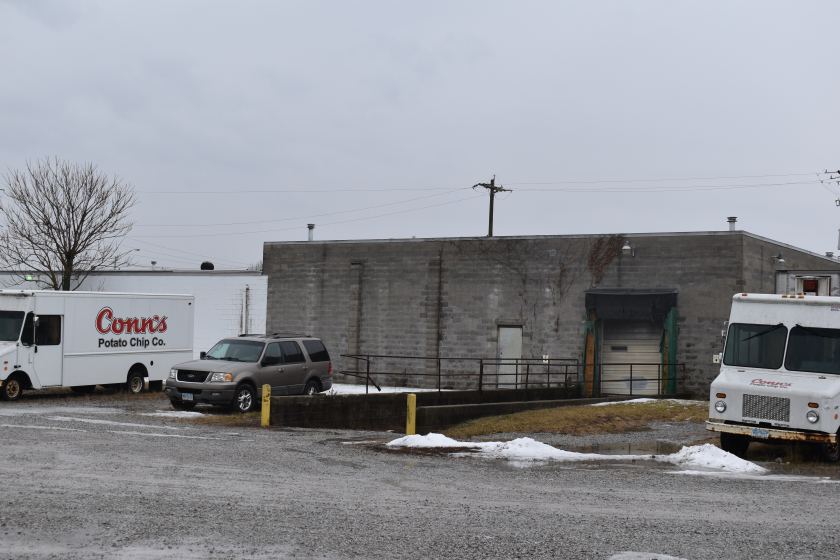
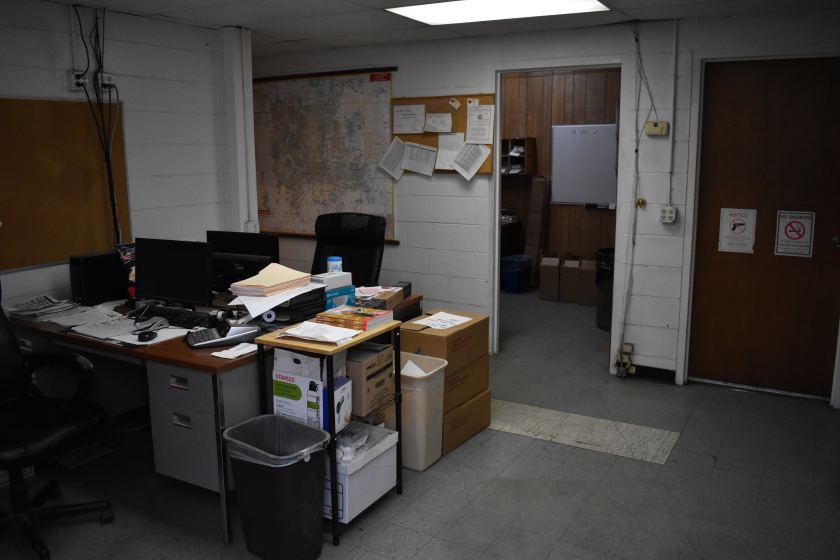
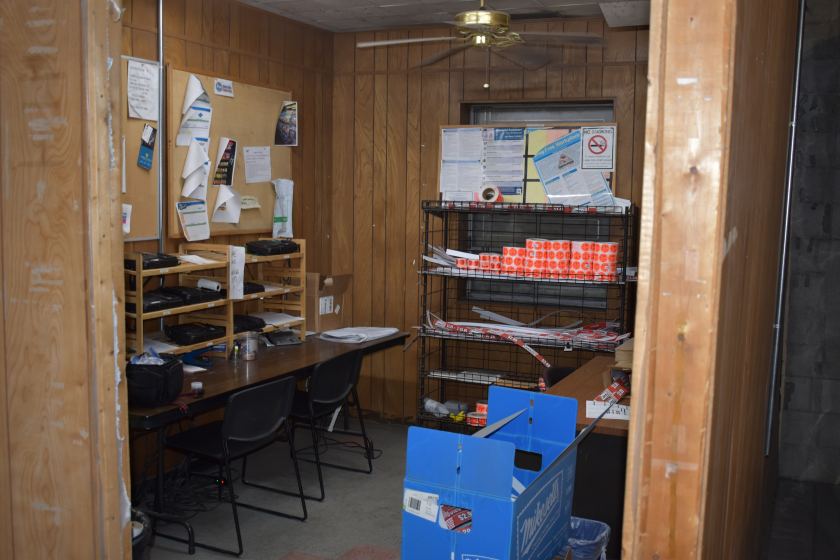
Flex-Office-Warehouse
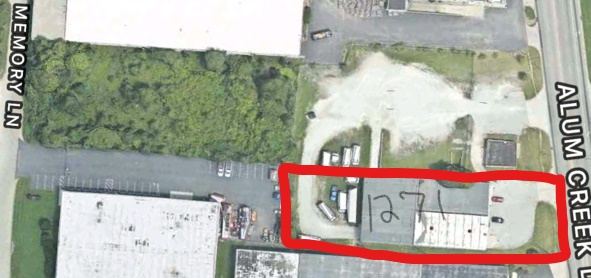
1271 Alum Creek Drive Columbus, OH 43209
1271 Alum Creek Drive Columbus, OH 43209

Details & Description
Property Highlights
- • 1.5 mile east of Downtown Columbus
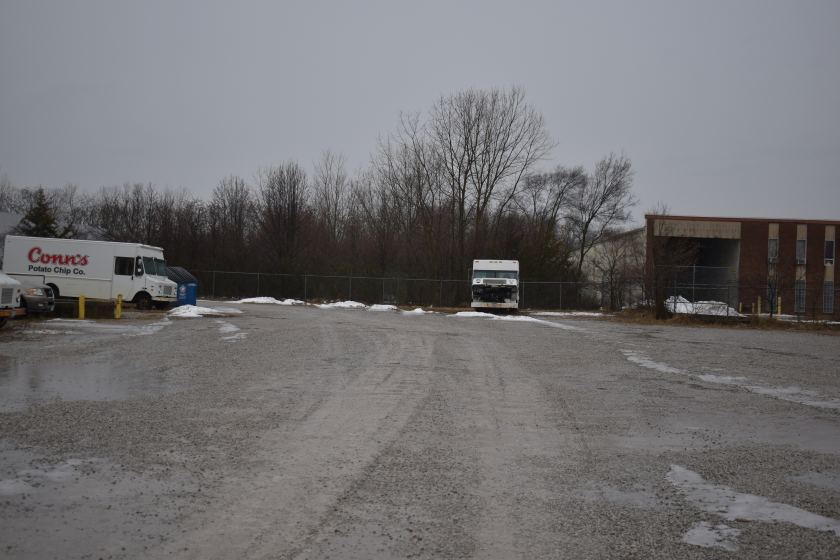
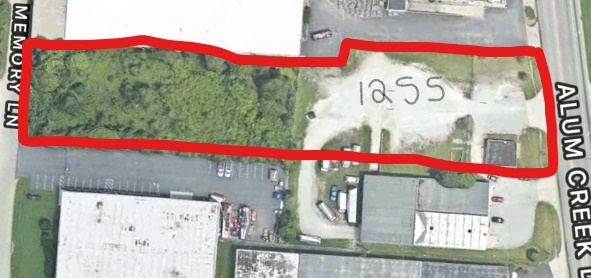
- • Large lot with plenty of potential
- • Road frontage on both back and front of property
- • Willing to split lots
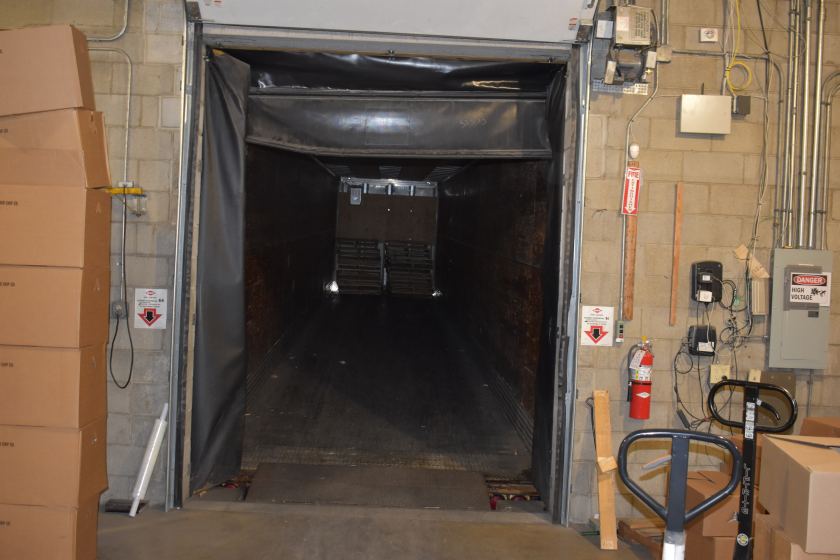
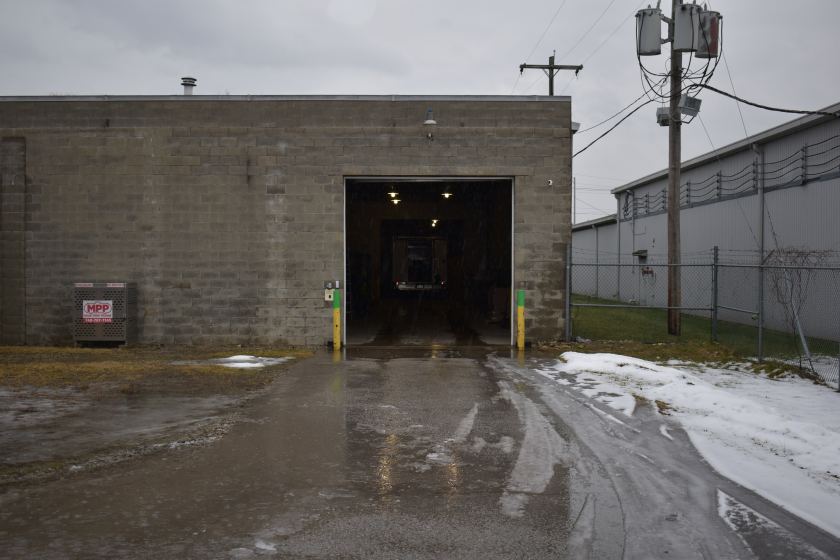
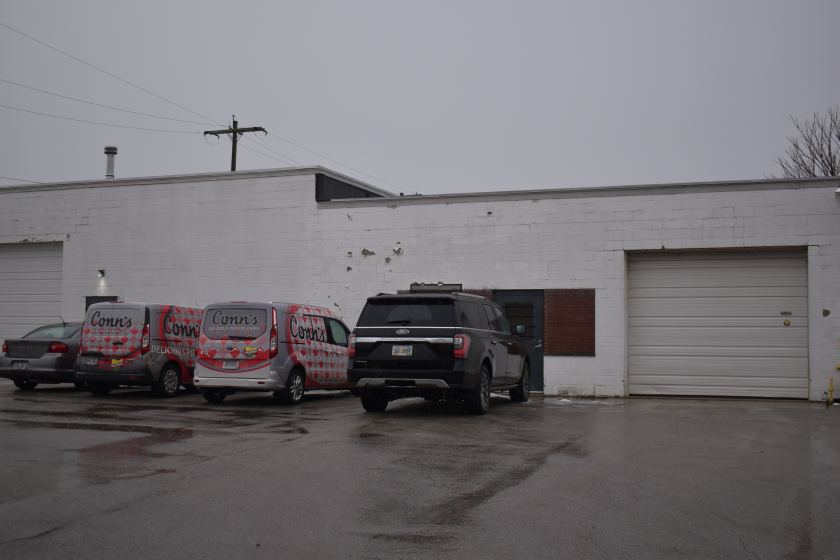
- • 2 DOCKS in warehouse
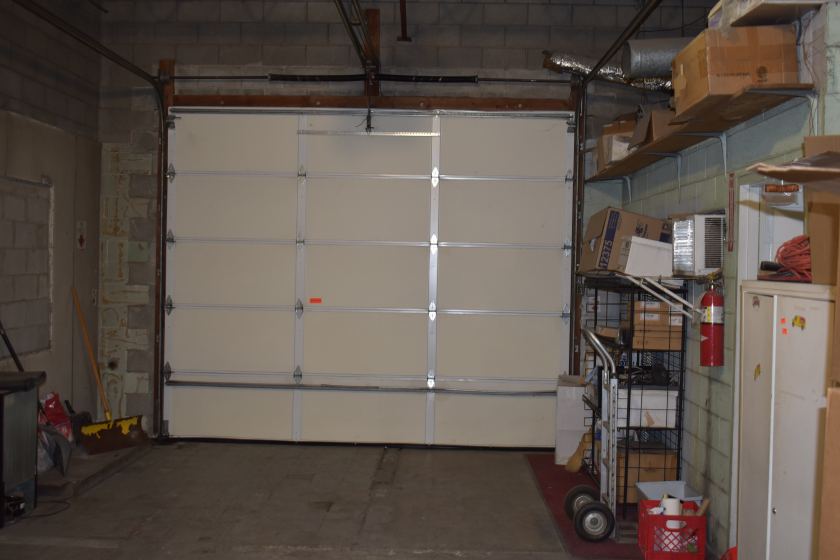
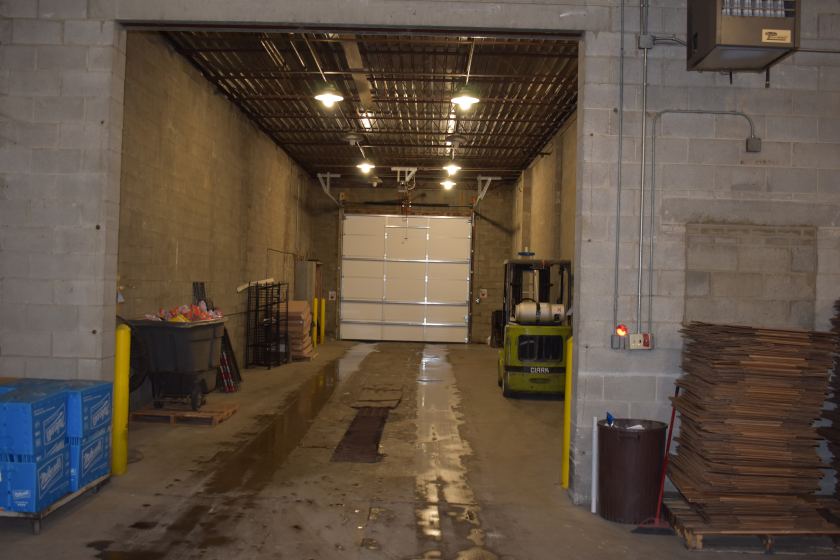
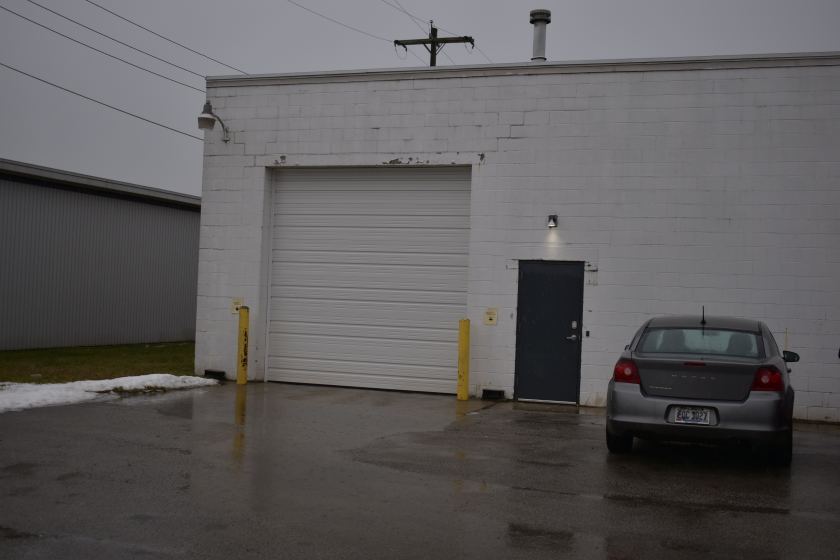
- • 3 pull in garage doors
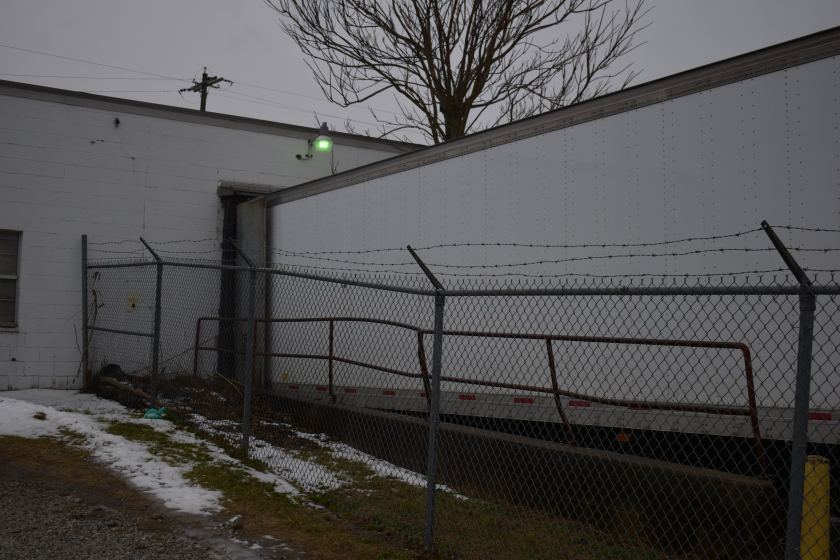
Additional Photos
Listing Agents

Thomas George
tomjr@connschips.com
tomjr@connschips.com
While we strive to provide the most accurate information, all listing information, and demographic data, is provided by third-parties. As such, MyEListing will not be responsible for the accuracy of the information. It is strongly recommended that you verify all information with the listing agent, and any relevant agencies, prior to making any decisions.