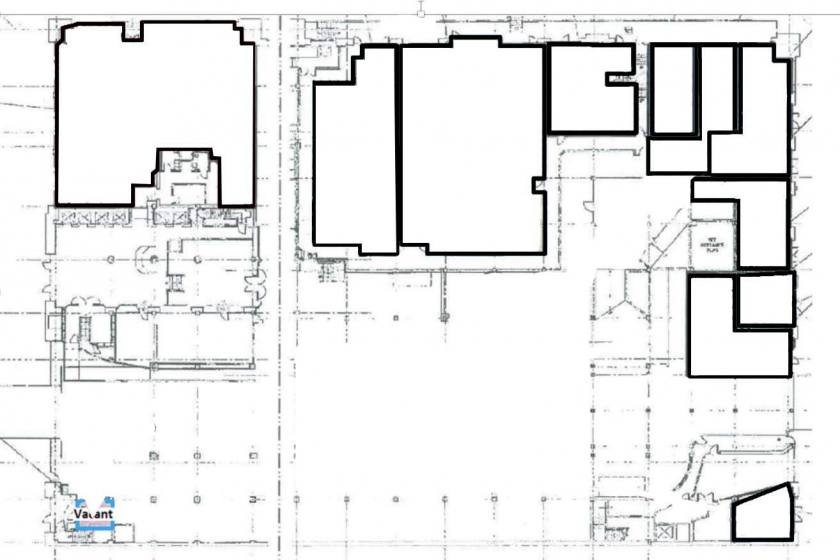
1-Mile | 3-Miles | 5-Miles | ||
---|---|---|---|---|
Total Population | 46,658 | 495,475 | 1,248,988 | |
Population Median Age | 41 | 35 | 35 | |
Population by Age | 0-9 Yrs | 1539 (3%) | 56495 (11%) | 154721 (12%) |
10-19 Yrs | 1864 (3%) | 63648 (12%) | 157908 (12%) | |
20-29 Yrs | 11007 (23%) | 104245 (21%) | 234000 (18%) | |
30-39 Yrs | 11216 (24%) | 85919 (17%) | 209257 (16%) | |
40-49 Yrs | 7001 (15%) | 65356 (13%) | 166603 (13%) | |
50-59 Yrs | 5416 (11%) | 50309 (10%) | 138903 (11%) | |
60-69 Yrs | 4372 (9%) | 36499 (7%) | 100413 (8%) | |
70+ Yrs | 4242 (9%) | 33005 (6%) | 87182 (6%) | |
Median HH Income | $43,860 | $40,043 | $44,350 | |
Total Household Income | < 24K | 11010 (40%) | 55624 (33%) | 116694 (29%) |
25-49K | 3324 (12%) | 40850 (24%) | 103436 (25%) | |
50-74K | 2507 (9%) | 25245 (15%) | 64567 (16%) | |
75-99K | 2273 (8%) | 15693 (9%) | 40359 (10%) | |
100-199K | 5625 (20%) | 21948 (13%) | 58707 (14%) | |
200K+ | 2579 (9%) | 6010 (3%) | 17314 (4%) | |
Highest Education Level | No Diploma | 5406 | 123906 | 297925 |
Diploma or GED | 5778 | 63702 | 174979 | |
Some College | 6890 | 45504 | 123105 | |
Assoc. Degree | 2539 | 15131 | 39797 | |
Bachelors Degree | 12012 | 55750 | 139225 | |
Higher Degree | 7180 | 22745 | 54899 | |
Total Housing Units | 31,603 | 179,708 | 433,414 | |
--Owner-Occupied | 2,365 | 19,692 | 83,966 | |
--Renter-Occupied | 24,953 | 145,678 | 317,111 | |
Owner-Occupied Values | < 100K | 13 | 344 | 1543 |
100-199K | 3 | 399 | 1997 | |
200-299K | 42 | 1746 | 6328 | |
300-399K | 198 | 3298 | 13755 | |
400-499K | 331 | 3174 | 14065 | |
500K+ | 1778 | 10730 | 46279 | |
Total Working Age Population | 44,215 | 404,154 | 1,002,333 | |
In Work Force | 26,830 | 257,390 | 652,318 | |
Not In Work Force | 17,385 | 146,764 | 350,015 | |
Workforce Employed | 24,834 | 237,890 | 605,636 | |
Workforce Unemployed | 1,989 | 19,457 | 46,526 | |
Civlian Workforce | 26,823 | 257,346 | 652,163 | |
Military Workforce | 7 | 44 | 155 | |
Total Households | 27,319 | 165,370 | 401,077 | |
Family Households | 5,527 | 87,574 | 240,060 | |
Non-Family Households | 21,791 | 77,796 | 161,017 | |
Married Couple | 4,184 | 47,487 | 134,961 | |
Other Family | 1,343 | 40,086 | 105,099 | |
Married w/Child | 975 | 20,245 | 59,171 | |
Single Male w/Child | 239 | 5,930 | 14,211 | |
Single Female w/Child | 310 | 13,316 | 33,919 |
Population Change Last Two Decades - Plus Projection
2000 | % | 2010 | % | 2020 | % | 2030 | |
---|---|---|---|---|---|---|---|
California | 33,871,648 | +10 | 37,253,956 | +9 | 40,467,295 | +8 | 43,631,295 |
Los Angeles County | 9,519,338 | +3 | 9,818,605 | +6 | 10,369,367 | +4 | 10,759,850 |
Total Working Age Population:
Total Households:
Total Working Age Population:
Total Households:
Total Working Age Population:
Total Households: