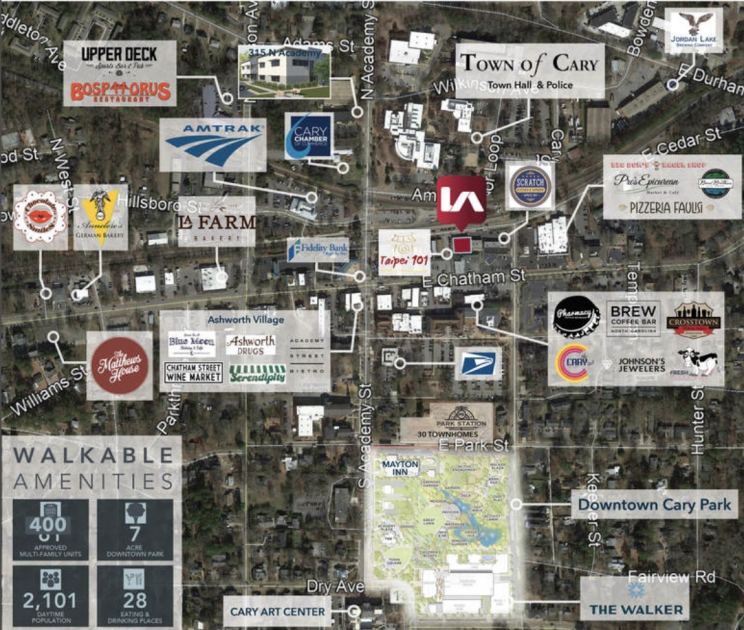
Retail Space
150 East Cedar Street Cary, NC 27511
150 East Cedar Street Cary, NC 27511

Details & Description
Property Highlights
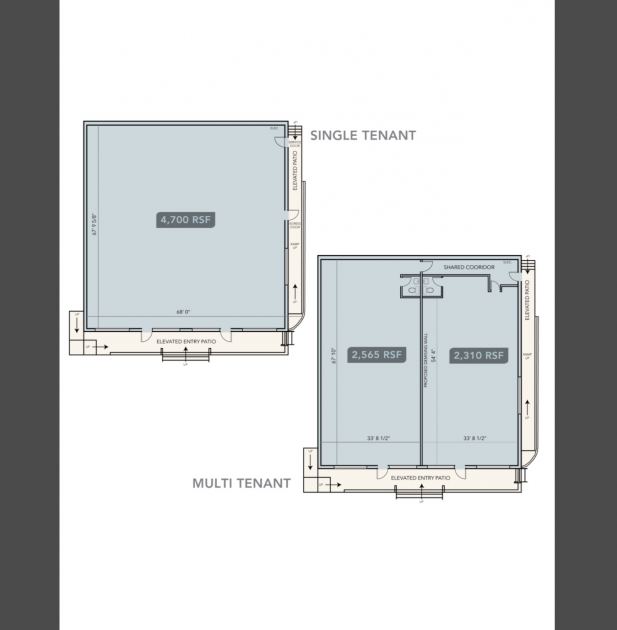
- • Restaurant space totaling 4,700 RSF
- • Grease trap in place
- • Ability to subdivide Minimum divisible 2,310 RSF
Listing Agents

Stone Alexander
O: 919-591-2275
M: 919-600-2397
salexander@lee-associates.com
O: 919-591-2275
M: 919-600-2397
salexander@lee-associates.com
While we strive to provide the most accurate information, all listing information, and demographic data, is provided by third-parties. As such, MyEListing will not be responsible for the accuracy of the information. It is strongly recommended that you verify all information with the listing agent, and any relevant agencies, prior to making any decisions.