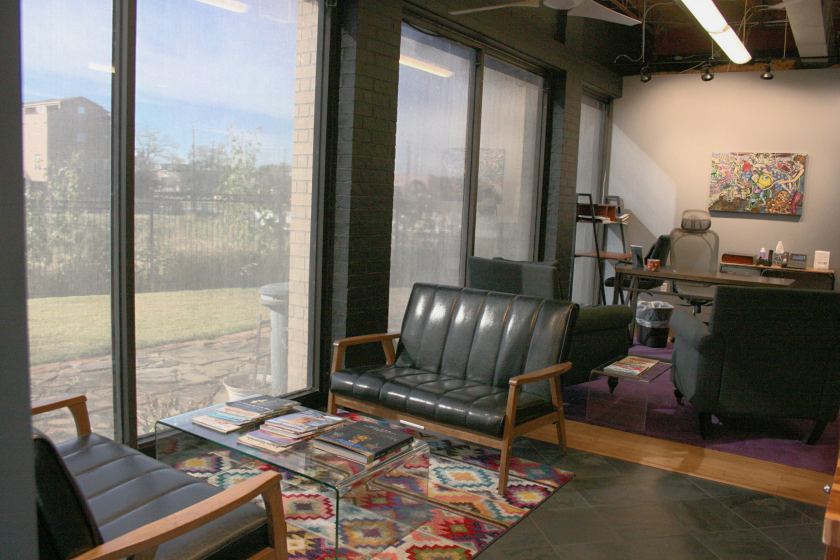
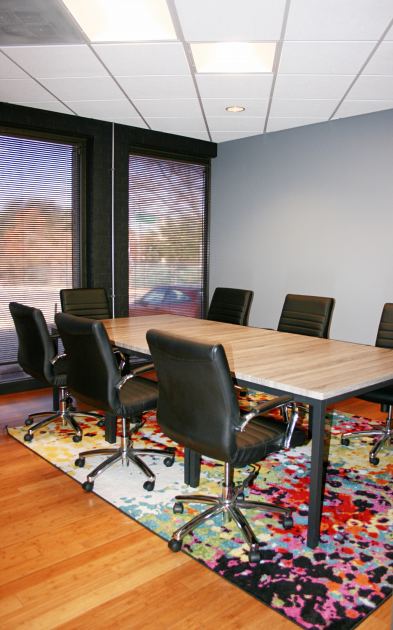
1-Mile | 3-Miles | 5-Miles | ||
---|---|---|---|---|
Total Population | 20,617 | 172,297 | 414,155 | |
Population Median Age | 35 | 37 | 37 | |
Population by Age | 0-9 Yrs | 1875 (9%) | 15148 (8%) | 45134 (10%) |
10-19 Yrs | 606 (2%) | 9748 (5%) | 36268 (8%) | |
20-29 Yrs | 6068 (29%) | 38926 (22%) | 81745 (19%) | |
30-39 Yrs | 5246 (25%) | 39785 (23%) | 80699 (19%) | |
40-49 Yrs | 2768 (13%) | 23368 (13%) | 52896 (12%) | |
50-59 Yrs | 1573 (7%) | 19506 (11%) | 47618 (11%) | |
60-69 Yrs | 1752 (8%) | 16637 (9%) | 39822 (9%) | |
70+ Yrs | 730 (3%) | 9179 (5%) | 29973 (7%) | |
Median HH Income | $110,899 | $98,288 | $78,769 | |
Total Household Income | < 24K | 912 (8%) | 11229 (13%) | 33756 (18%) |
25-49K | 1013 (9%) | 10418 (12%) | 29040 (16%) | |
50-74K | 1569 (14%) | 11172 (13%) | 24725 (13%) | |
75-99K | 1499 (13%) | 8929 (10%) | 18070 (10%) | |
100-199K | 3305 (30%) | 21962 (26%) | 40474 (22%) | |
200K+ | 2679 (24%) | 18564 (22%) | 34428 (19%) | |
Highest Education Level | No Diploma | 551 | 11749 | 39087 |
Diploma or GED | 904 | 15180 | 43621 | |
Some College | 1732 | 16837 | 40000 | |
Assoc. Degree | 773 | 6068 | 13302 | |
Bachelors Degree | 7415 | 47700 | 89931 | |
Higher Degree | 5203 | 37278 | 74264 | |
Total Housing Units | 12,324 | 93,240 | 207,667 | |
--Owner-Occupied | 4,871 | 39,501 | 82,096 | |
--Renter-Occupied | 6,105 | 42,772 | 98,396 | |
Owner-Occupied Values | < 100K | 73 | 1458 | 8291 |
100-199K | 191 | 3401 | 9747 | |
200-299K | 471 | 4729 | 10295 | |
300-399K | 1356 | 8074 | 13055 | |
400-499K | 1065 | 7391 | 10821 | |
500K+ | 1714 | 14449 | 29888 | |
Total Working Age Population | 18,366 | 151,582 | 348,501 | |
In Work Force | 15,820 | 113,677 | 241,139 | |
Not In Work Force | 2,546 | 37,905 | 107,362 | |
Workforce Employed | 15,457 | 110,240 | 230,996 | |
Workforce Unemployed | 358 | 3,398 | 10,013 | |
Civlian Workforce | 15,814 | 113,638 | 241,009 | |
Military Workforce | 6 | 39 | 130 | |
Total Households | 10,977 | 82,273 | 180,492 | |
Family Households | 4,235 | 34,962 | 87,423 | |
Non-Family Households | 6,742 | 47,312 | 93,070 | |
Married Couple | 3,715 | 28,121 | 64,687 | |
Other Family | 520 | 6,841 | 22,736 | |
Married w/Child | 1,211 | 8,927 | 23,303 | |
Single Male w/Child | 122 | 725 | 2,486 | |
Single Female w/Child | 109 | 2,575 | 8,399 |
Population Change Last Two Decades - Plus Projection
2000 | % | 2010 | % | 2020 | % | 2030 | |
---|---|---|---|---|---|---|---|
Texas | 20,851,820 | +21 | 25,145,561 | +18 | 29,677,668 | +18 | 34,894,452 |
Harris County | 3,400,578 | +20 | 4,092,459 | +22 | 4,978,845 | +19 | 5,924,750 |
Total Working Age Population:
Total Households:
Total Working Age Population:
Total Households:
Total Working Age Population:
Total Households: