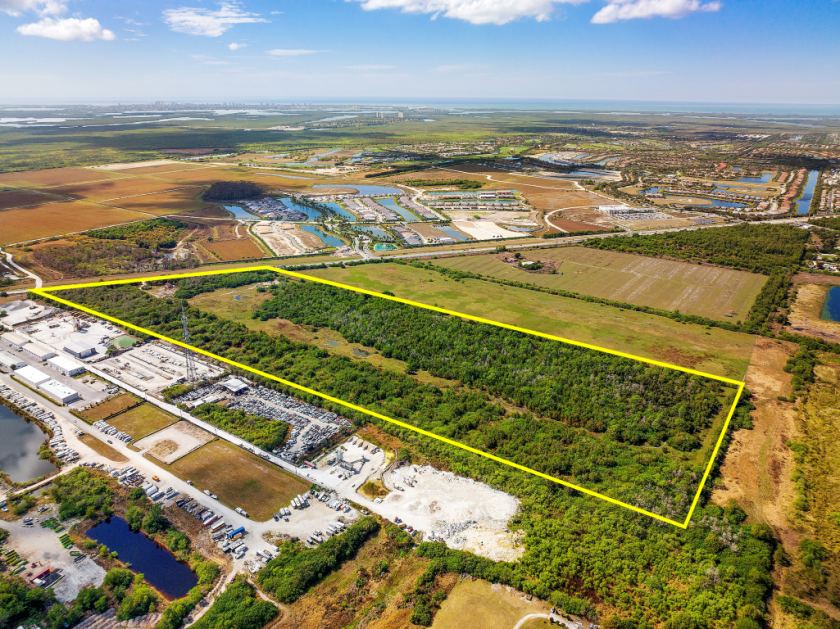
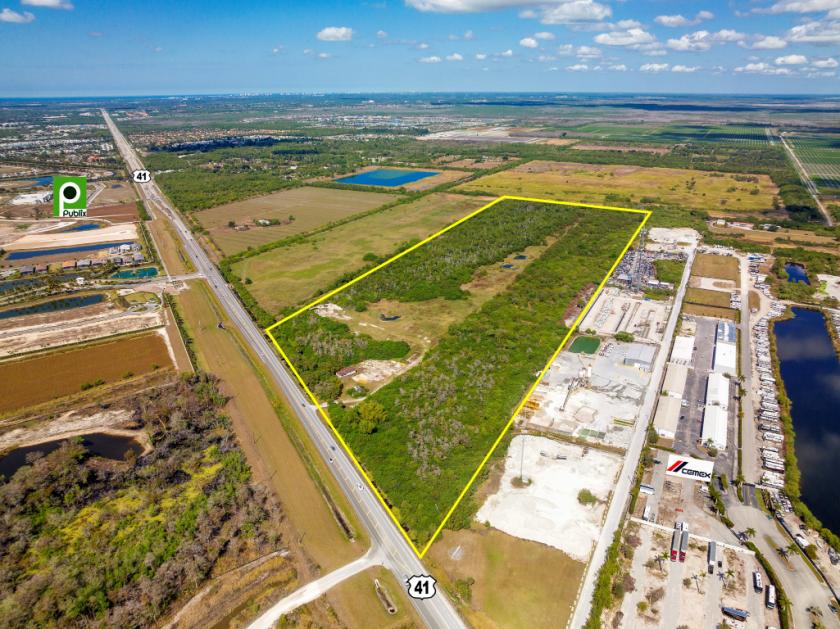
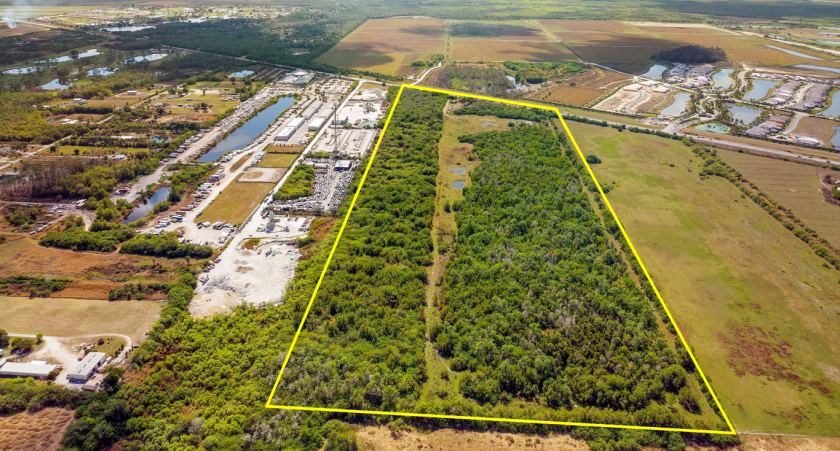
Commercial Land
15435 Tamiami Trail East Naples, FL 34114
15435 Tamiami Trail East Naples, FL 34114
Details & Description
Property Highlights
• Great potential for ILF, ALF, memory care, skilled nursing or other senior living uses
• Located in Rural Fringe Mixed Use District - Receiving Lands
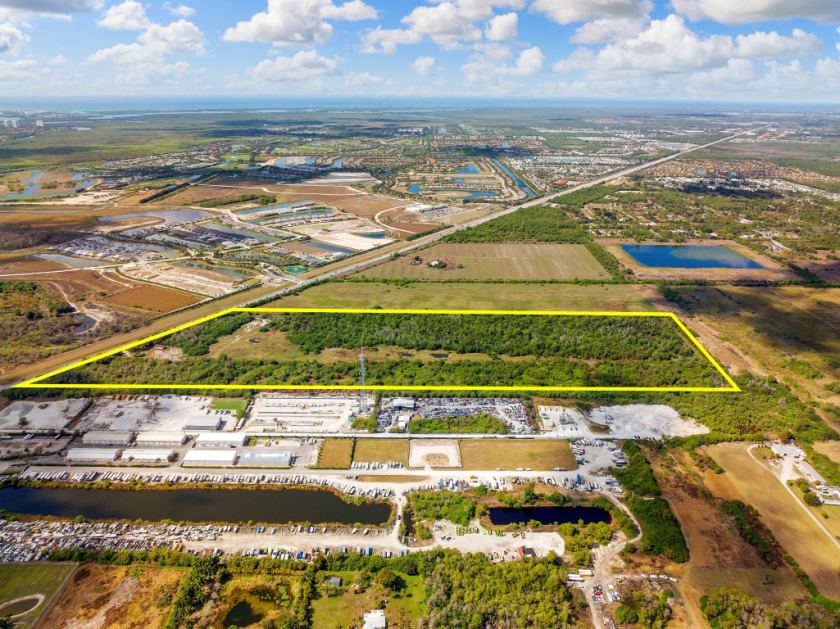
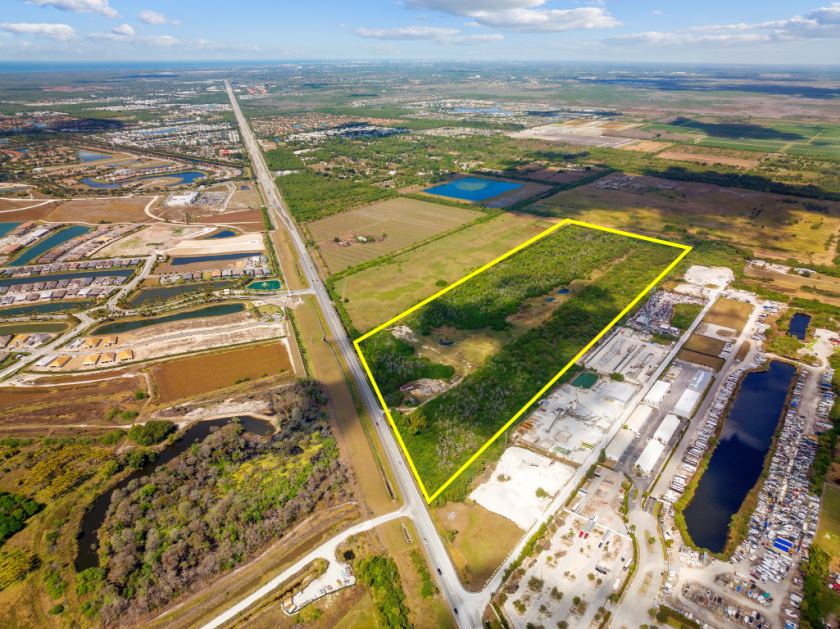
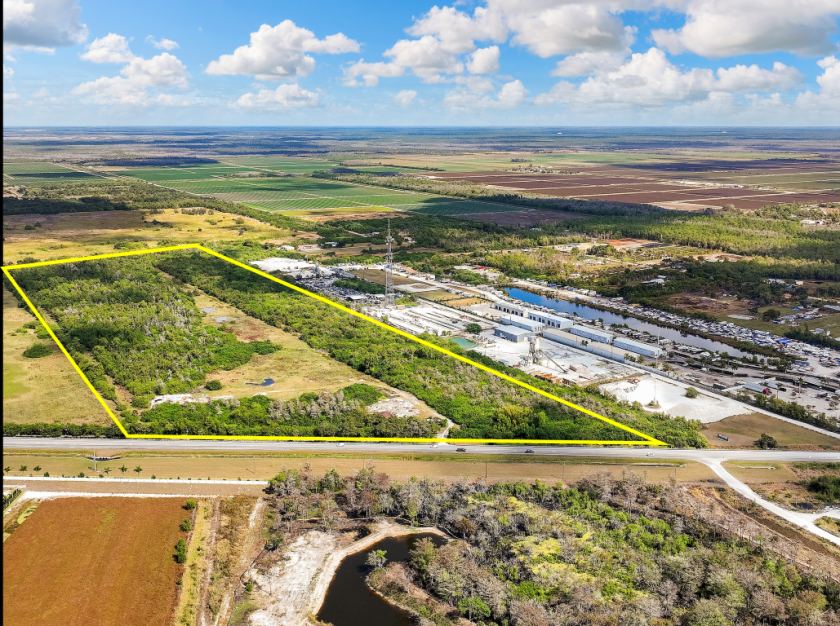
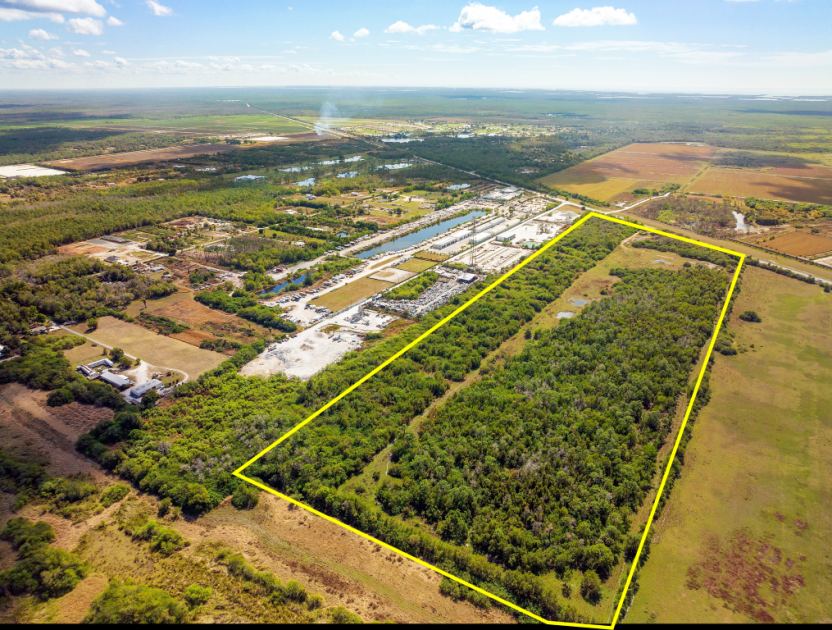
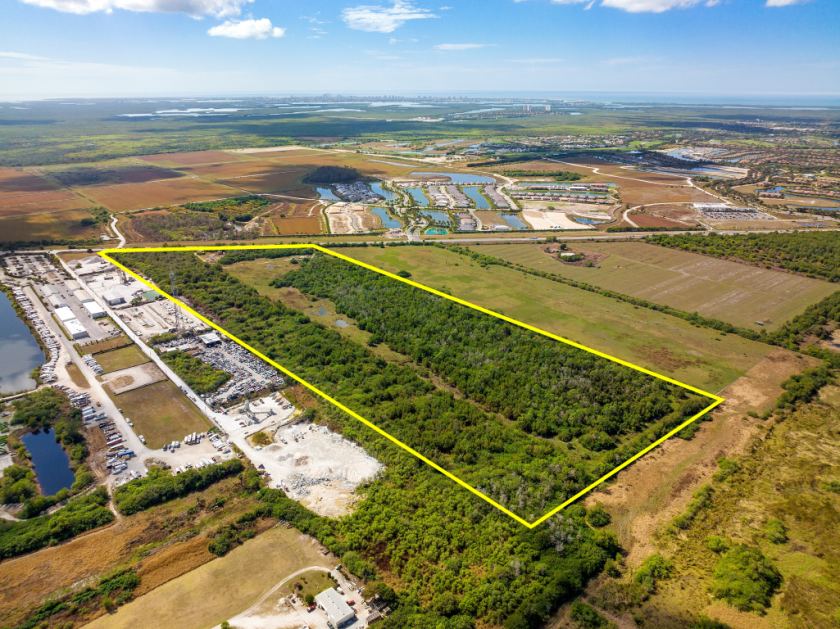
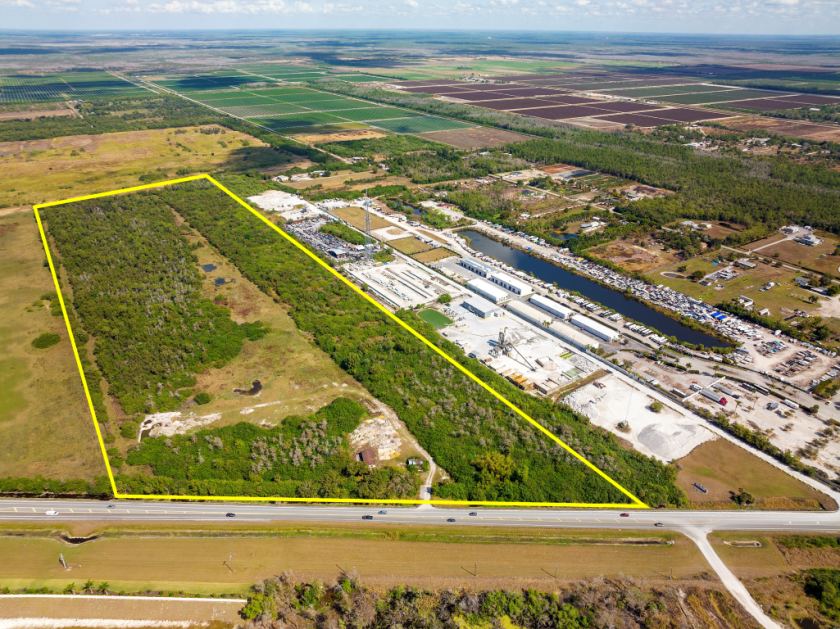
Additional Photos
Listing Agents

Gary Tasman
O: 239-489-3600
M: 239-470-9646
atutor@cpswfl.com
O: 239-489-3600
M: 239-470-9646
atutor@cpswfl.com
While we strive to provide the most accurate information, all listing information, and demographic data, is provided by third-parties. As such, MyEListing will not be responsible for the accuracy of the information. It is strongly recommended that you verify all information with the listing agent, and any relevant agencies, prior to making any decisions.