Industrial Properties
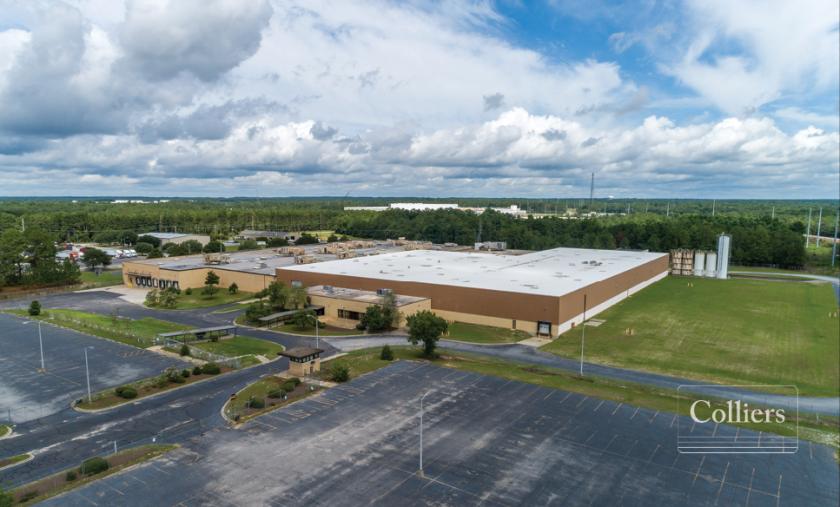
10700 Farrow Road Blythewood, SC 29016
10700 Farrow Road Blythewood, SC 29016
Details & Description
Property Highlights
- • 100 wet system
- • 17 dock-high doors l 2 drive-in doors
- • Pre-engineered metal and masonry construction
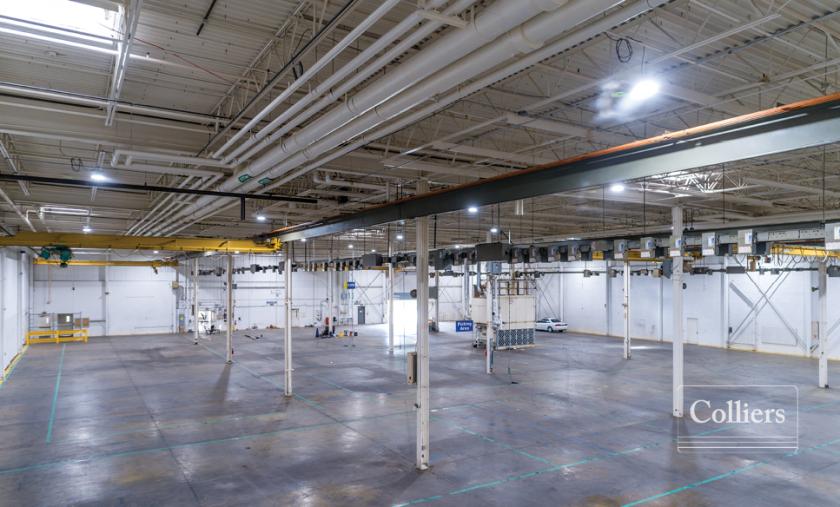
- • Clear height of 21 - 276
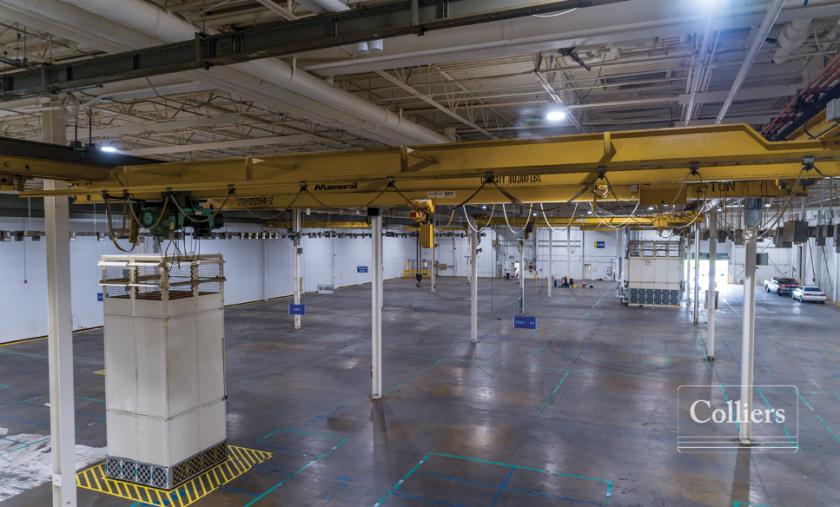
- • 29 bridge cranes from 2-5 tons
Additional Photos

Listing Agents

Chuck Salley
O: 803-401-4266
M: 803-463-4843
Chuck.Salley@colliers.com
O: 803-401-4266
M: 803-463-4843
Chuck.Salley@colliers.com
While we strive to provide the most accurate information, all listing information, and demographic data, is provided by third-parties. As such, MyEListing will not be responsible for the accuracy of the information. It is strongly recommended that you verify all information with the listing agent, and any relevant agencies, prior to making any decisions.


