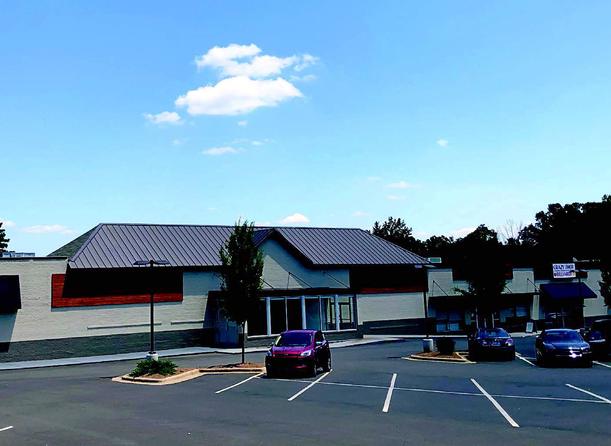
Retail Space
652 North Churton Street Hillsborough, NC 27278
652 North Churton Street Hillsborough, NC 27278
Details & Description
Property Highlights
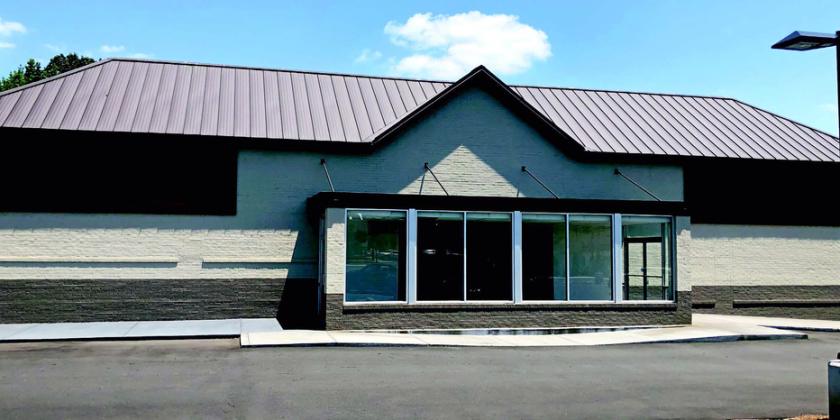
- • 3,953 SF end cap space available
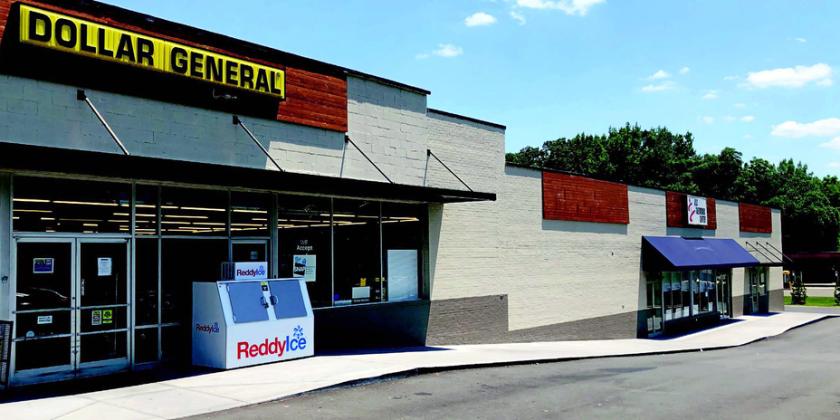
- • Visibility and access from US Hwy 70 and NC 86
- • Traffic counts 18,500 VPD on NC 86
- • Lease Rate Call broker for pricing
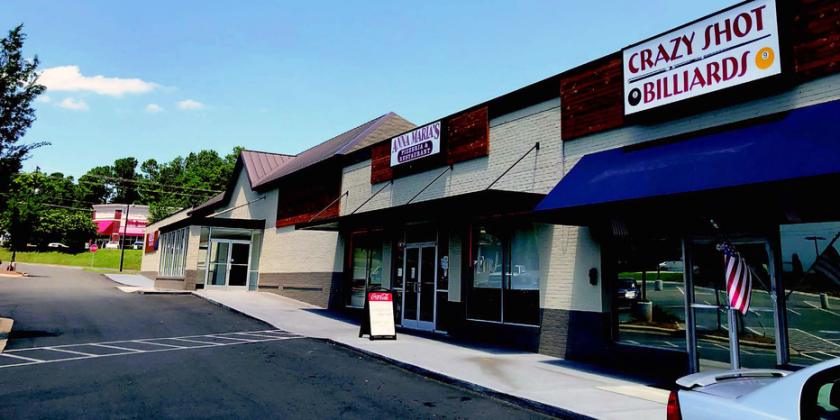
Additional Photos
Listing Agents

Russell Stewart
O: 919-576-2506
M: 919-909-9779
rstewart@lee-associates.com
O: 919-576-2506
M: 919-909-9779
rstewart@lee-associates.com
While we strive to provide the most accurate information, all listing information, and demographic data, is provided by third-parties. As such, MyEListing will not be responsible for the accuracy of the information. It is strongly recommended that you verify all information with the listing agent, and any relevant agencies, prior to making any decisions.


