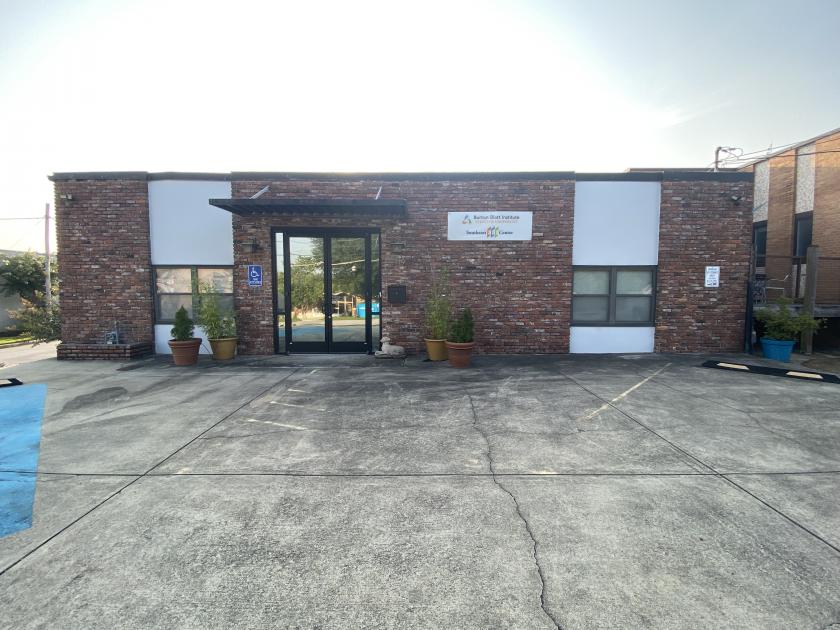
Office Space
1419 Mayson Street Northeast Atlanta, GA 30324
1419 Mayson Street Northeast Atlanta, GA 30324

Details & Description
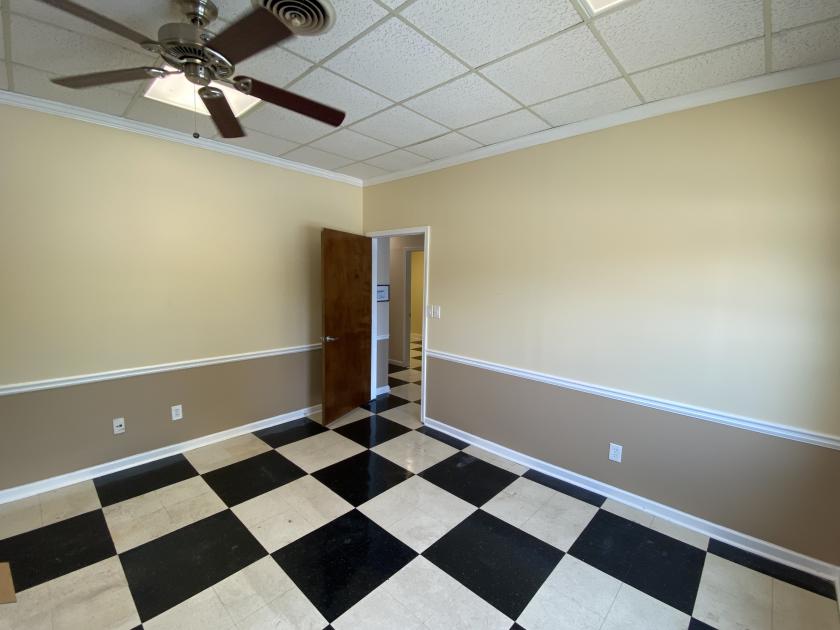
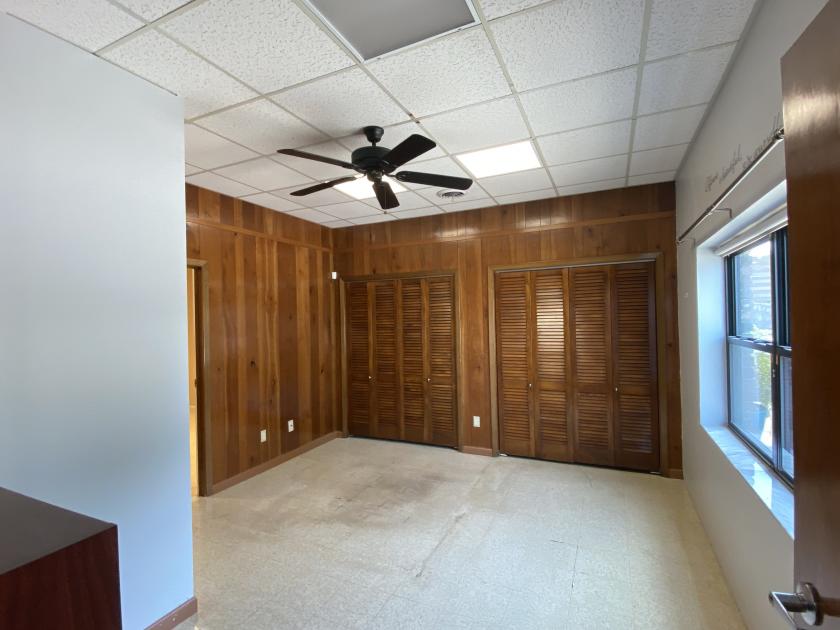
Additional Photos

Listing Agents

Sam Lurie
samantha@pollockcommercial.com
samantha@pollockcommercial.com

Jeff Pollock
O: 404-662-2182
jp@pollockcommercial.com
O: 404-662-2182
jp@pollockcommercial.com
While we strive to provide the most accurate information, all listing information, and demographic data, is provided by third-parties. As such, MyEListing will not be responsible for the accuracy of the information. It is strongly recommended that you verify all information with the listing agent, and any relevant agencies, prior to making any decisions.


