Retail Space
107 East Broadway Street Lenoir City, TN 37771
107 East Broadway Street Lenoir City, TN 37771

Details & Description
Property Highlights
• Active merchants association with special street events and celebrations throughout the year
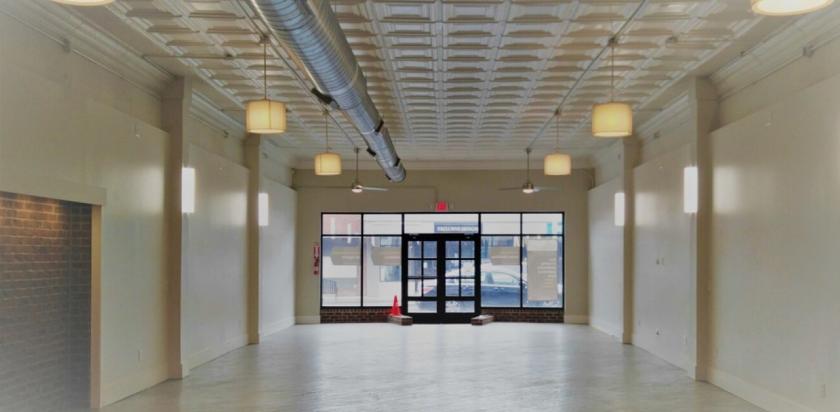
• Ideal storefront exposure on Broadway, with excellent vehicle and foot traffic
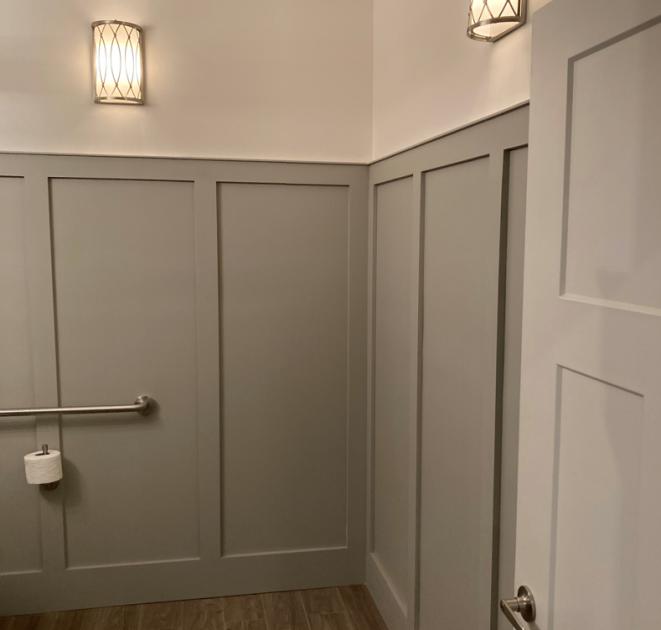
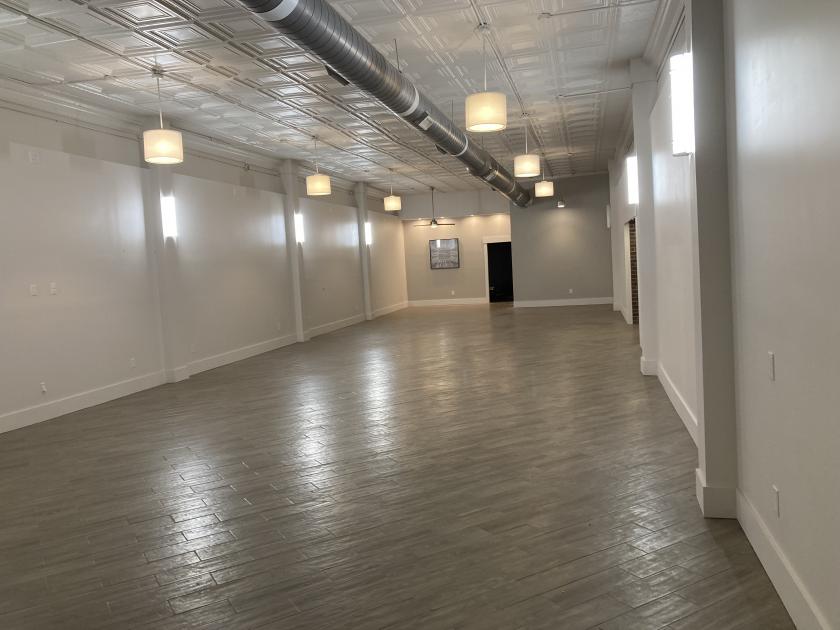
Additional Photos


Listing Agents

Lyndon Bolton
Canson LLC
O: 865-254-2000
M: 865-254-2000
lsbolton1037@gmail.com
Canson LLC
O: 865-254-2000
M: 865-254-2000
lsbolton1037@gmail.com
While we strive to provide the most accurate information, all listing information, and demographic data, is provided by third-parties. As such, MyEListing will not be responsible for the accuracy of the information. It is strongly recommended that you verify all information with the listing agent, and any relevant agencies, prior to making any decisions.