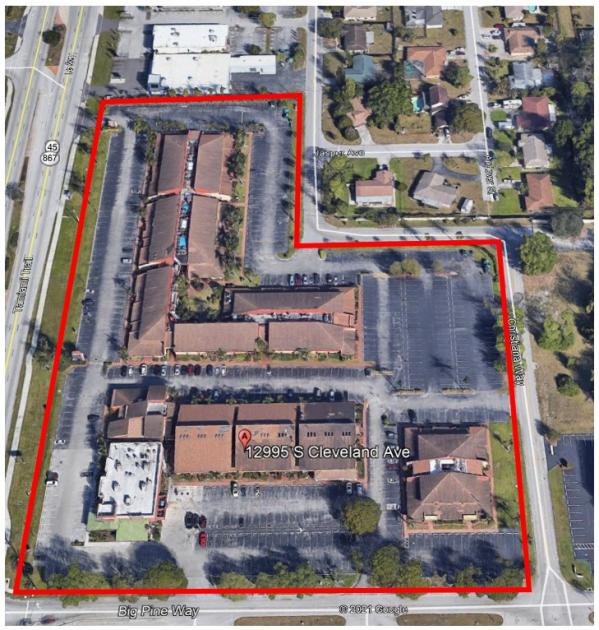
1-Mile | 3-Miles | 5-Miles | ||
---|---|---|---|---|
Total Population | 10,411 | 70,409 | 159,736 | |
Population Median Age | 49 | 47 | 49 | |
Population by Age | 0-9 Yrs | 505 (4%) | 5703 (8%) | 12918 (8%) |
10-19 Yrs | 653 (6%) | 6610 (9%) | 13347 (8%) | |
20-29 Yrs | 1609 (15%) | 7985 (11%) | 15083 (9%) | |
30-39 Yrs | 925 (8%) | 7215 (10%) | 15547 (9%) | |
40-49 Yrs | 1182 (11%) | 7027 (9%) | 15548 (9%) | |
50-59 Yrs | 1682 (16%) | 9081 (12%) | 20357 (12%) | |
60-69 Yrs | 1380 (13%) | 10213 (14%) | 26432 (16%) | |
70+ Yrs | 2475 (23%) | 16575 (23%) | 40504 (25%) | |
Median HH Income | $50,714 | $54,845 | $56,627 | |
Total Household Income | < 24K | 967 (22%) | 5705 (19%) | 13477 (19%) |
25-49K | 1189 (27%) | 7786 (26%) | 17019 (24%) | |
50-74K | 992 (22%) | 6201 (20%) | 12478 (18%) | |
75-99K | 490 (11%) | 3801 (12%) | 8271 (12%) | |
100-199K | 663 (15%) | 4901 (16%) | 12109 (17%) | |
200K+ | 86 (1%) | 1339 (4%) | 5483 (7%) | |
Highest Education Level | No Diploma | 1055 | 4758 | 10503 |
Diploma or GED | 2732 | 14596 | 33397 | |
Some College | 1646 | 11199 | 25208 | |
Assoc. Degree | 925 | 5305 | 12066 | |
Bachelors Degree | 1427 | 11829 | 27930 | |
Higher Degree | 1048 | 7104 | 17909 | |
Total Housing Units | 6,533 | 40,068 | 99,216 | |
--Owner-Occupied | 2,452 | 19,184 | 47,300 | |
--Renter-Occupied | 1,935 | 10,549 | 21,537 | |
Owner-Occupied Values | < 100K | 529 | 3286 | 4954 |
100-199K | 1201 | 6471 | 12504 | |
200-299K | 546 | 4715 | 11392 | |
300-399K | 69 | 2334 | 7555 | |
400-499K | 13 | 890 | 3786 | |
500K+ | 93 | 1489 | 7110 | |
Total Working Age Population | 9,539 | 60,532 | 138,382 | |
In Work Force | 5,660 | 33,739 | 69,945 | |
Not In Work Force | 3,879 | 26,793 | 68,437 | |
Workforce Employed | 5,411 | 32,444 | 66,862 | |
Workforce Unemployed | 214 | 1,255 | 2,796 | |
Civlian Workforce | 5,626 | 33,699 | 69,657 | |
Military Workforce | 35 | 40 | 288 | |
Total Households | 4,387 | 29,733 | 68,837 | |
Family Households | 2,173 | 16,709 | 40,416 | |
Non-Family Households | 2,214 | 13,025 | 28,421 | |
Married Couple | 1,558 | 12,569 | 32,544 | |
Other Family | 615 | 4,139 | 7,872 | |
Married w/Child | 367 | 2,679 | 6,910 | |
Single Male w/Child | 44 | 728 | 1,274 | |
Single Female w/Child | 111 | 1,413 | 2,687 |
Population Change Last Two Decades - Plus Projection
2000 | % | 2010 | % | 2020 | % | 2030 | |
---|---|---|---|---|---|---|---|
Florida | 15,982,378 | +18 | 18,801,310 | +14 | 21,517,610 | +13 | 24,340,457 |
Collier County | 251,377 | +28 | 321,520 | +19 | 382,826 | +17 | 449,537 |
Lee County | 440,888 | +40 | 618,754 | +21 | 747,388 | +19 | 892,108 |
Total Working Age Population:
Total Households:
Total Working Age Population:
Total Households:
Total Working Age Population:
Total Households: