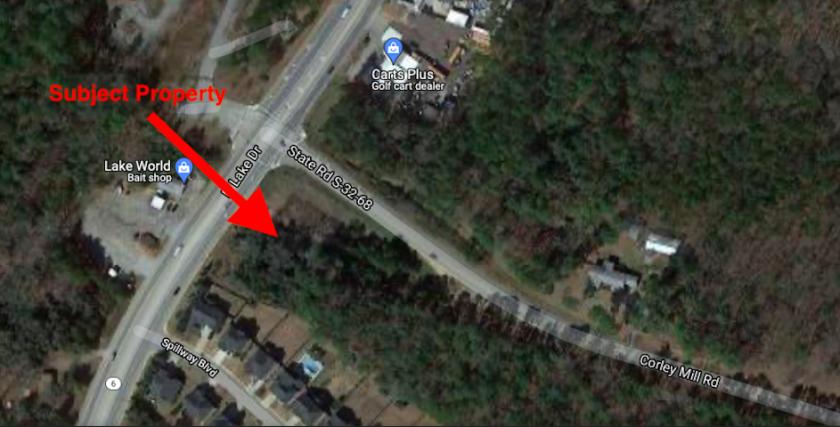
1-Mile | 3-Miles | 5-Miles | ||
---|---|---|---|---|
Total Population | 1,768 | 24,264 | 82,648 | |
Population Median Age | 36 | 40 | 40 | |
Population by Age | 0-9 Yrs | 290 (16%) | 3033 (12%) | 9995 (12%) |
10-19 Yrs | 277 (15%) | 3485 (14%) | 10373 (12%) | |
20-29 Yrs | 144 (8%) | 2064 (8%) | 8514 (10%) | |
30-39 Yrs | 257 (14%) | 3014 (12%) | 10764 (13%) | |
40-49 Yrs | 276 (15%) | 3485 (14%) | 11077 (13%) | |
50-59 Yrs | 257 (14%) | 3313 (13%) | 11468 (13%) | |
60-69 Yrs | 152 (8%) | 3270 (13%) | 11018 (13%) | |
70+ Yrs | 115 (6%) | 2601 (10%) | 9439 (11%) | |
Median HH Income | $109,013 | $92,109 | $75,986 | |
Total Household Income | < 24K | 42 (6%) | 875 (9%) | 4056 (12%) |
25-49K | 58 (9%) | 1206 (13%) | 5950 (18%) | |
50-74K | 97 (15%) | 1622 (17%) | 6089 (18%) | |
75-99K | 88 (14%) | 1338 (14%) | 4811 (14%) | |
100-199K | 212 (34%) | 3077 (33%) | 9112 (27%) | |
200K+ | 121 (19%) | 1120 (12%) | 2551 (7%) | |
Highest Education Level | No Diploma | 25 | 510 | 2783 |
Diploma or GED | 114 | 2586 | 11237 | |
Some College | 139 | 2937 | 11660 | |
Assoc. Degree | 133 | 1859 | 5994 | |
Bachelors Degree | 424 | 5360 | 16275 | |
Higher Degree | 277 | 3572 | 10509 | |
Total Housing Units | 677 | 10,097 | 35,047 | |
--Owner-Occupied | 562 | 7,631 | 25,113 | |
--Renter-Occupied | 55 | 1,608 | 7,456 | |
Owner-Occupied Values | < 100K | 20 | 262 | 2276 |
100-199K | 146 | 3449 | 12191 | |
200-299K | 141 | 1896 | 5838 | |
300-399K | 97 | 927 | 2299 | |
400-499K | 63 | 443 | 1060 | |
500K+ | 95 | 653 | 1449 | |
Total Working Age Population | 1,282 | 18,884 | 66,039 | |
In Work Force | 884 | 12,448 | 43,238 | |
Not In Work Force | 399 | 6,437 | 22,801 | |
Workforce Employed | 862 | 12,045 | 41,390 | |
Workforce Unemployed | 17 | 364 | 1,745 | |
Civlian Workforce | 878 | 12,410 | 43,135 | |
Military Workforce | 5 | 38 | 103 | |
Total Households | 618 | 9,239 | 32,569 | |
Family Households | 497 | 6,959 | 22,947 | |
Non-Family Households | 120 | 2,280 | 9,622 | |
Married Couple | 431 | 5,835 | 18,287 | |
Other Family | 67 | 1,124 | 4,659 | |
Married w/Child | 248 | 2,550 | 7,058 | |
Single Male w/Child | 13 | 240 | 656 | |
Single Female w/Child | 24 | 478 | 1,879 |
Population Change Last Two Decades - Plus Projection
2000 | % | 2010 | % | 2020 | % | 2030 | |
---|---|---|---|---|---|---|---|
South Carolina | 4,012,012 | +15 | 4,625,364 | +9 | 5,020,400 | +9 | 5,488,460 |
Lexington County | 216,014 | +21 | 262,391 | +12 | 294,510 | +13 | 333,180 |
Richland County | 320,677 | +20 | 384,504 | +3 | 395,920 | +8 | 425,960 |
Total Working Age Population:
Total Households:
Total Working Age Population:
Total Households:
Total Working Age Population:
Total Households: