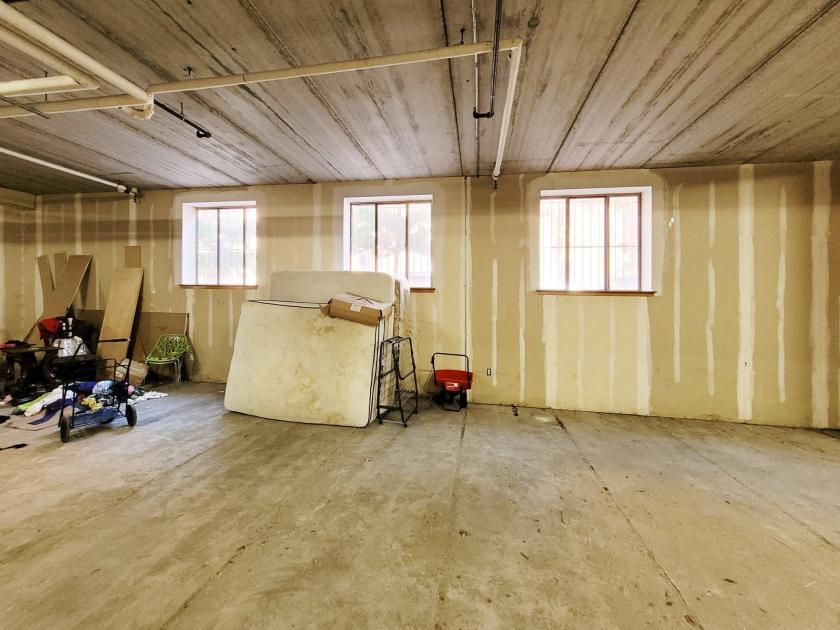
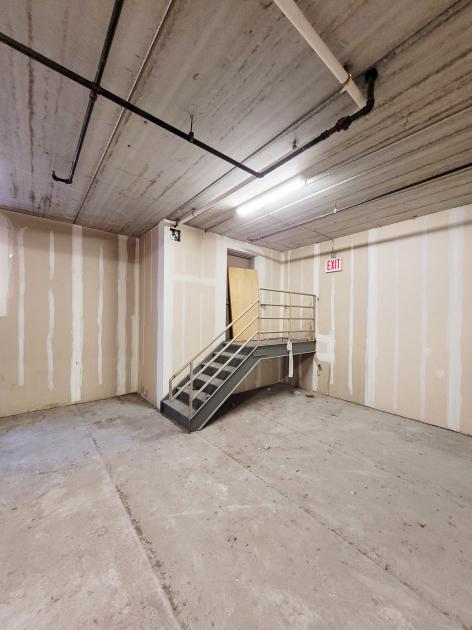
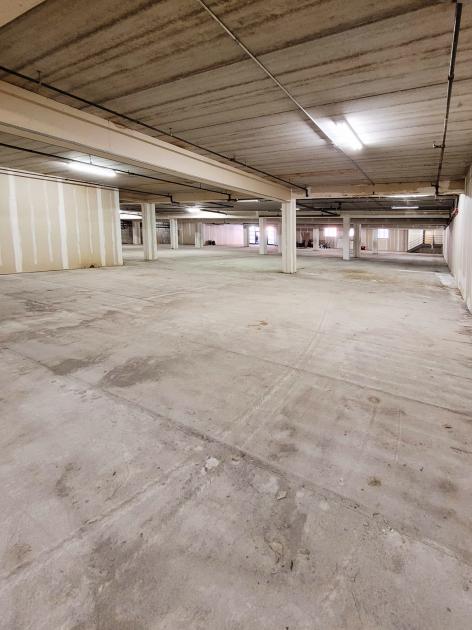
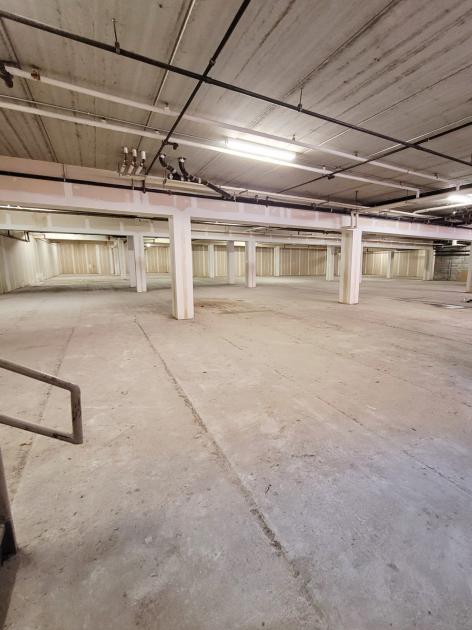
Office Space
1100 Franklin Avenue Bronx, NY 10456
1100 Franklin Avenue Bronx, NY 10456

Details & Description
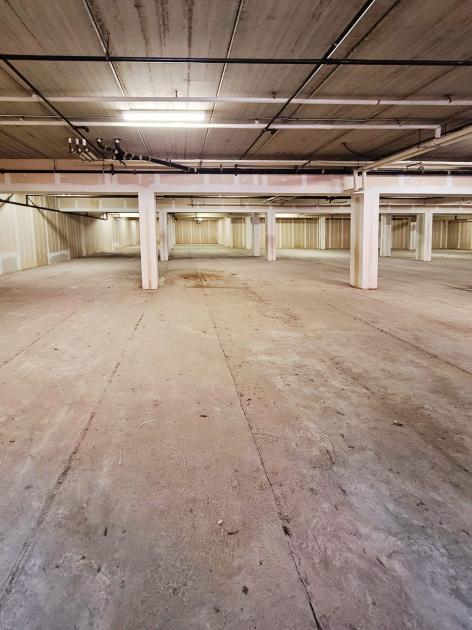
Property Highlights
- • Ground floor
- • 5,000 SF of outdoor roof
- • 11.5 ceilings
- • Parking on-site
- • Located within a 2-minute walk to Hines Park
- • Great for daycare, nonprofit, senior care, etc.
Additional Photos

Listing Agents

Shlomi Bagdadi
O: 718-437-6100
info@tristatecr.com
O: 718-437-6100
info@tristatecr.com
While we strive to provide the most accurate information, all listing information, and demographic data, is provided by third-parties. As such, MyEListing will not be responsible for the accuracy of the information. It is strongly recommended that you verify all information with the listing agent, and any relevant agencies, prior to making any decisions.