Industrial Properties
6101 Midway Street Sacramento, CA 95828
6101 Midway Street Sacramento, CA 95828

Details & Description
Property Highlights
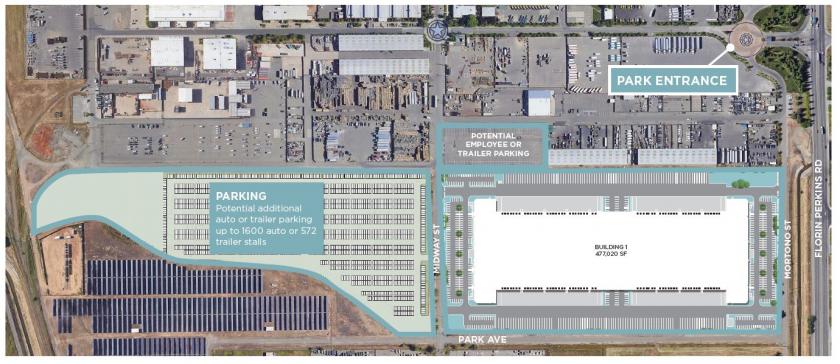
- • Total Building SF 477,020
- • Divisible to 120,000
- • Parcel size 26.94 acres
- • Overall building dimensions 480 X 1,260
- • Column Spacing 56 X 60
- • Speed Bay 60
Additional Photos


Listing Agents

John McManus
O: 510-891-5817
john.mcmanus@cushwake.com
O: 510-891-5817
john.mcmanus@cushwake.com
While we strive to provide the most accurate information, all listing information, and demographic data, is provided by third-parties. As such, MyEListing will not be responsible for the accuracy of the information. It is strongly recommended that you verify all information with the listing agent, and any relevant agencies, prior to making any decisions.


