Office Space
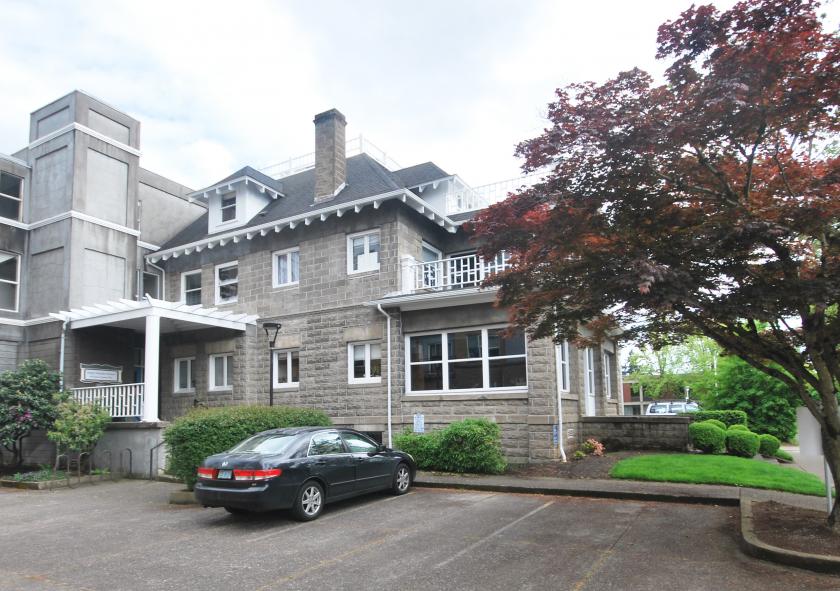
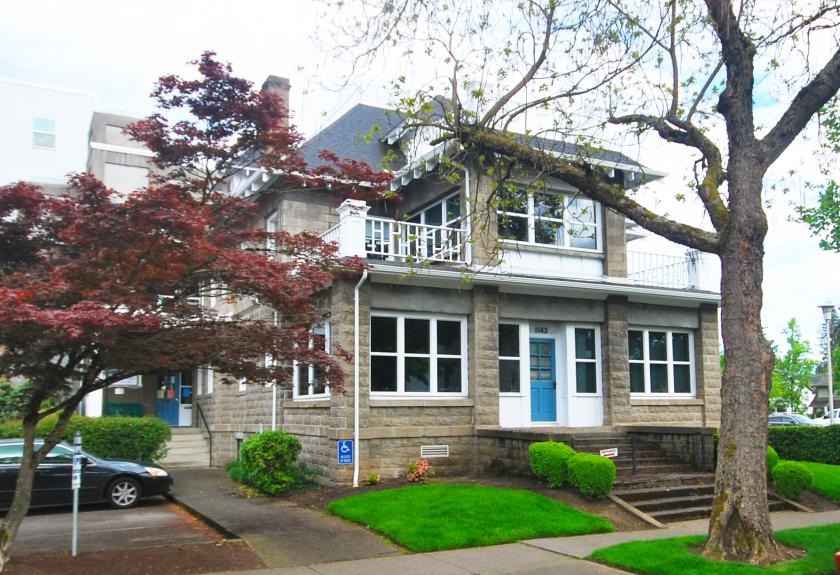
1143 Oak Street Eugene, OR 97401
1143 Oak Street Eugene, OR 97401
Details & Description
Property Highlights
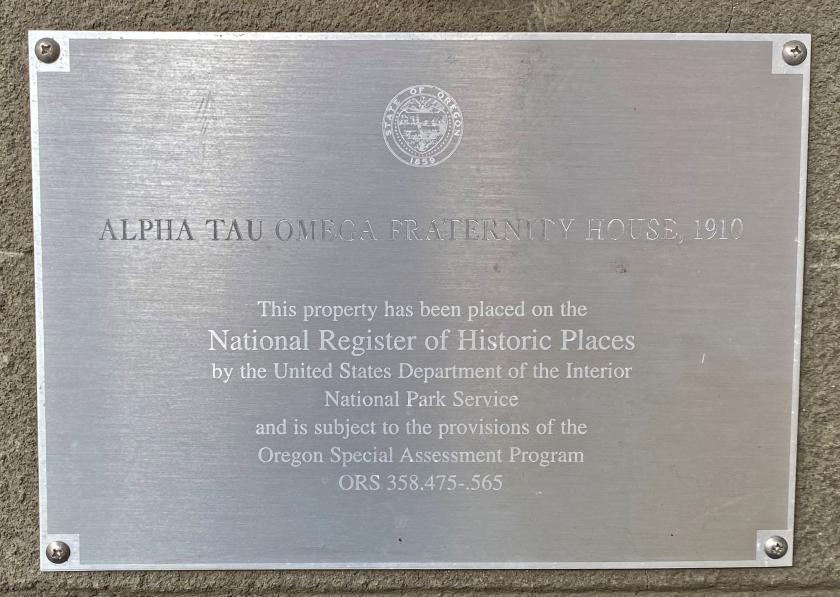
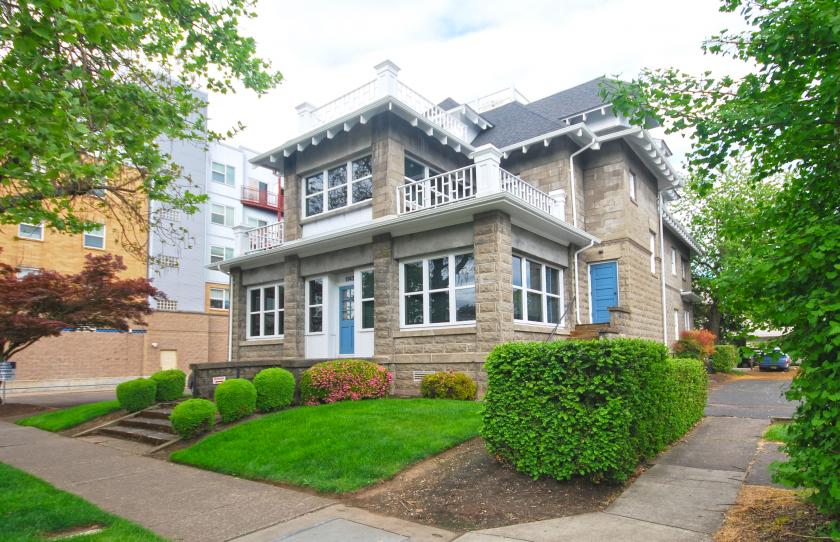
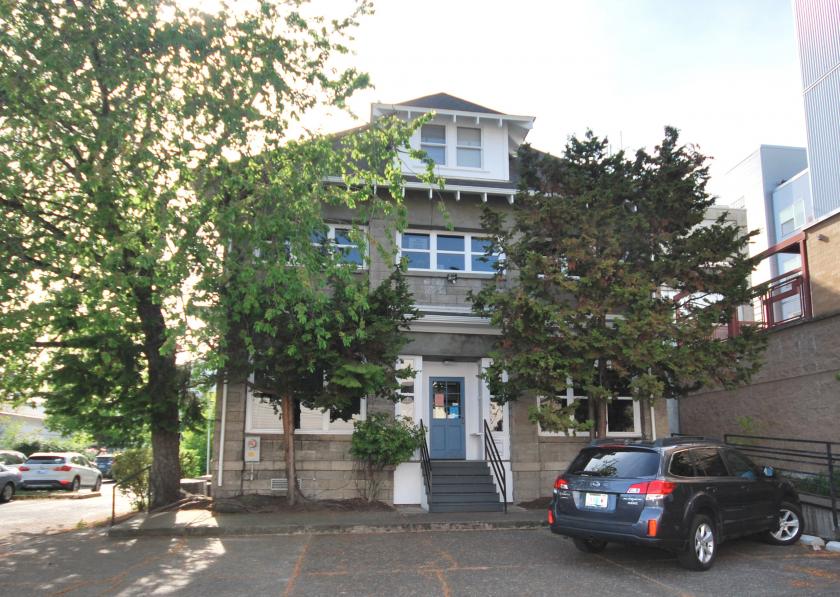
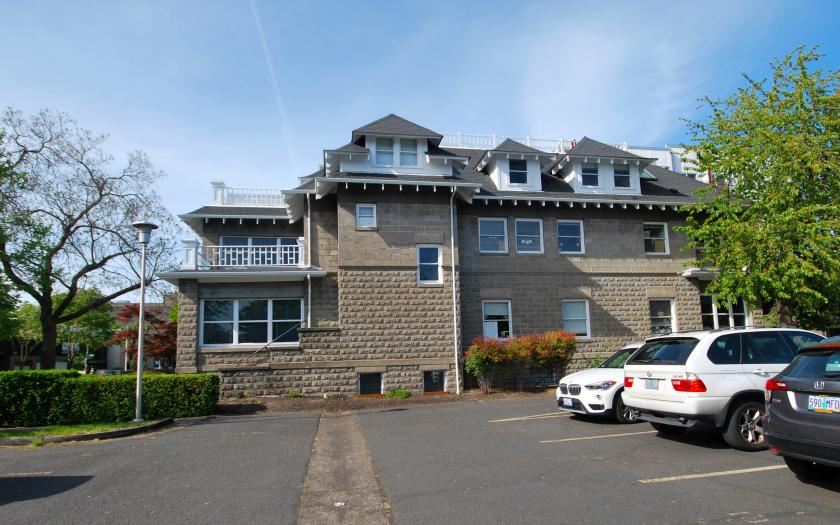
- • Historic Downtown Eugene Office Building
- • Elevator Served
- • Surface Parking
Additional Photos
Listing Agents

Bill Newland
O: 541-484-2214
bill@campbellre.com
O: 541-484-2214
bill@campbellre.com

Tim Campbell
O: 541-484-2214
timc@campbellre.com
O: 541-484-2214
timc@campbellre.com
While we strive to provide the most accurate information, all listing information, and demographic data, is provided by third-parties. As such, MyEListing will not be responsible for the accuracy of the information. It is strongly recommended that you verify all information with the listing agent, and any relevant agencies, prior to making any decisions.