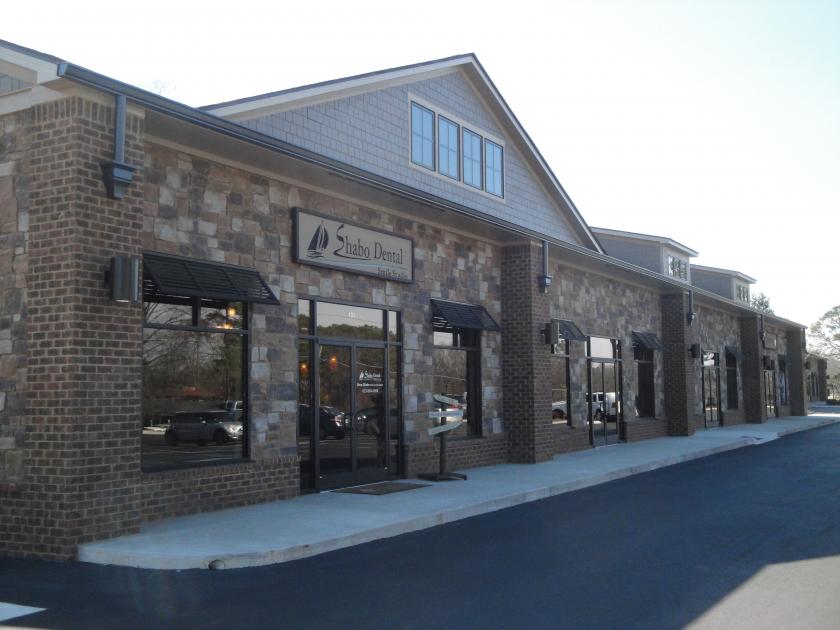
Office Space
1309 Panorama Drive Chattanooga, TN 37421
1309 Panorama Drive Chattanooga, TN 37421
Details & Description
Property Highlights
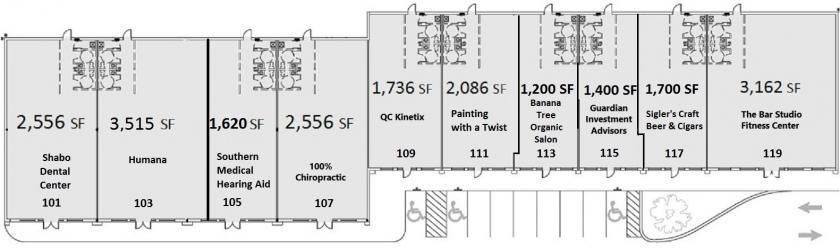
- • Over 50 Medical Tenants
- • Reputable and Reliable Tenants
- • Solid Investment
- • Adjacent to high-end apartments
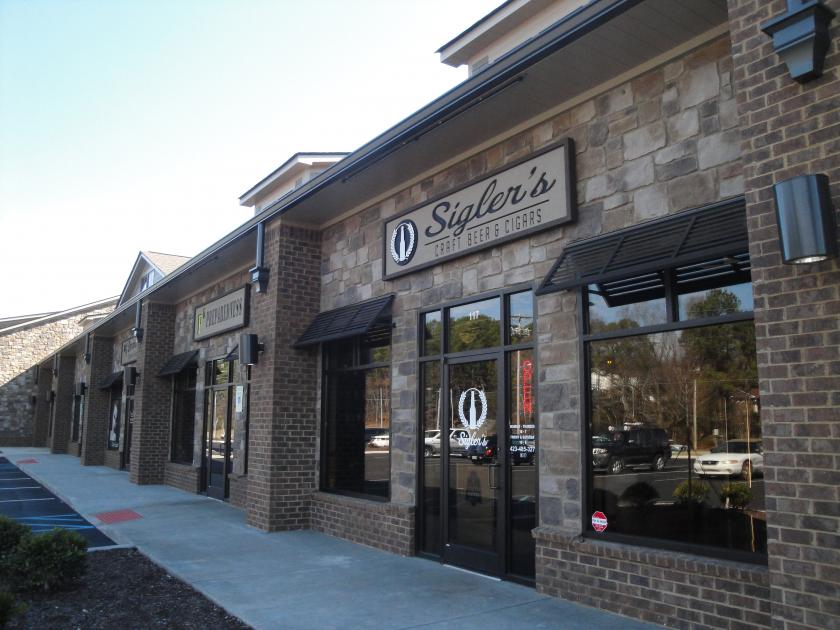
Additional Photos

Listing Agents

Heather Bevil
O: 423-800-8003
M: 678-266-2024
heather@chattanoogacommercial.net
O: 423-800-8003
M: 678-266-2024
heather@chattanoogacommercial.net
While we strive to provide the most accurate information, all listing information, and demographic data, is provided by third-parties. As such, MyEListing will not be responsible for the accuracy of the information. It is strongly recommended that you verify all information with the listing agent, and any relevant agencies, prior to making any decisions.


