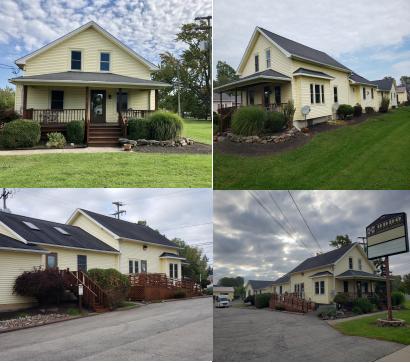
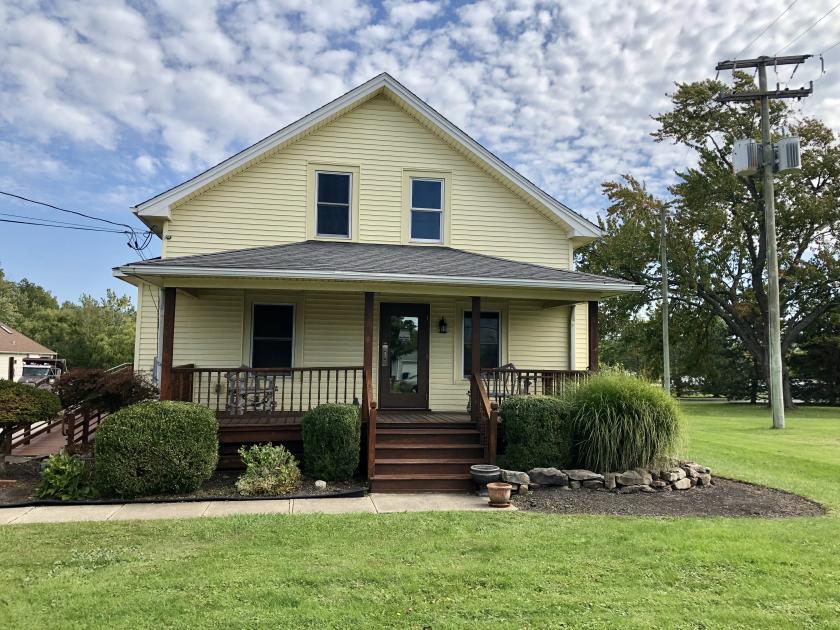
Retail Space
6399 Transit Road East Amherst, NY 14051
6399 Transit Road East Amherst, NY 14051
Details & Description
Property Highlights
- • Excellent Location - ClarenceEast Amherst
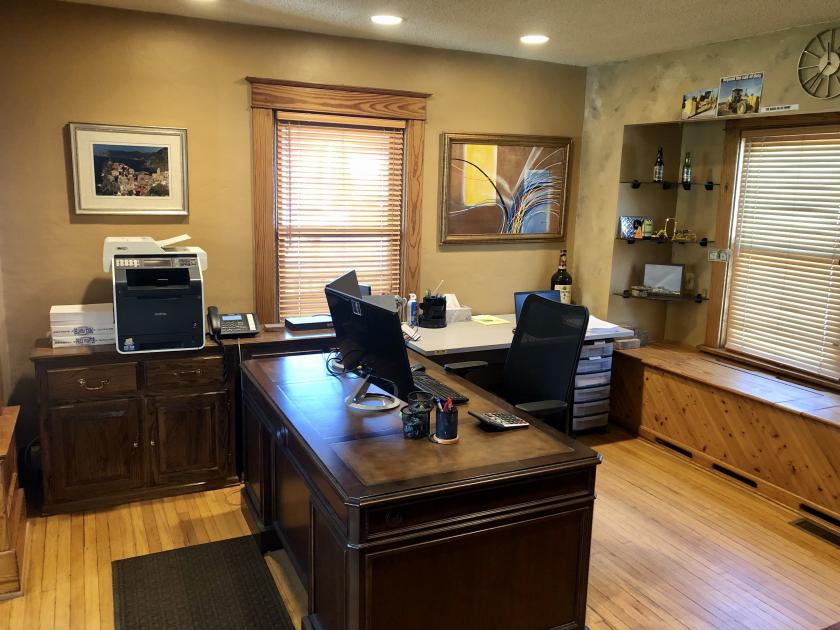
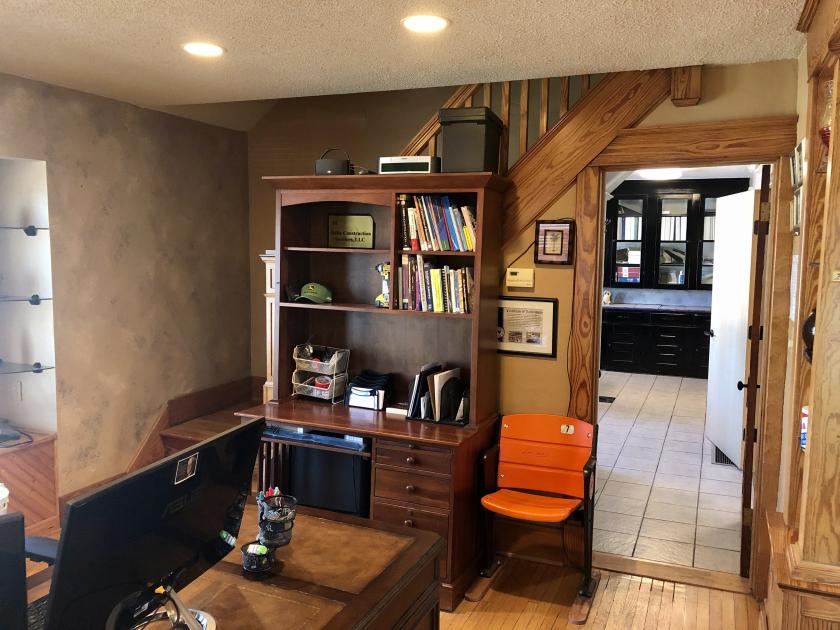
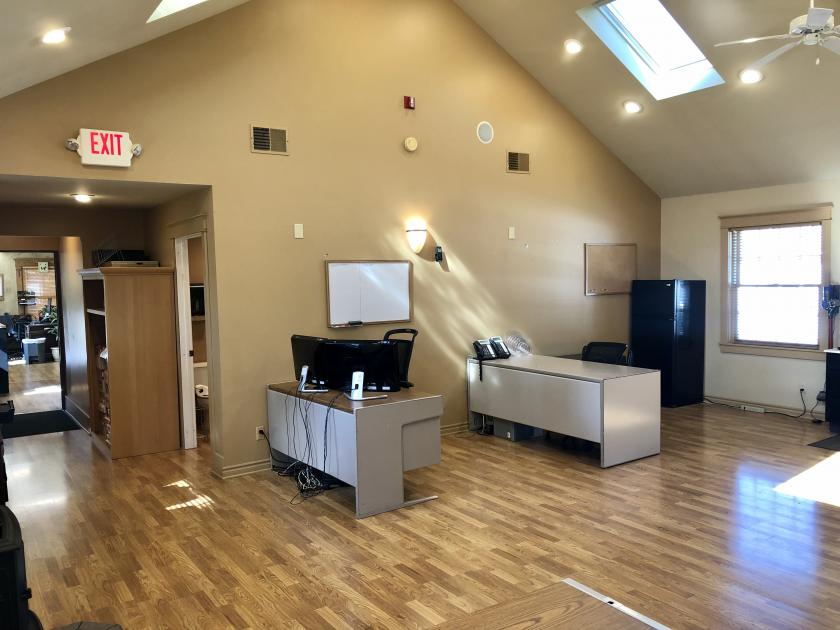
- • Unique Property with Office and Retail Space
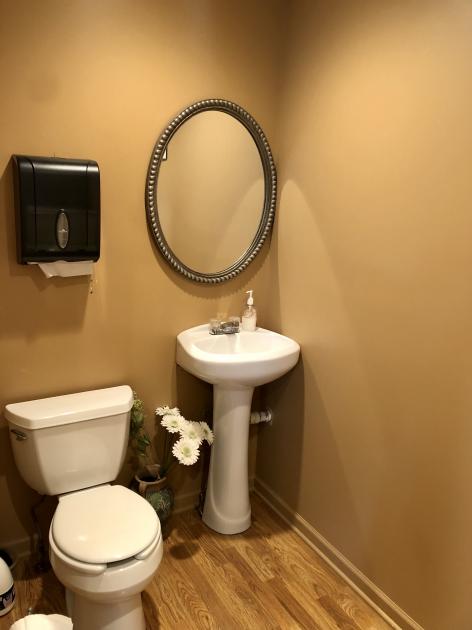
- • Hardwood Floors throughout
- • Lot Size 100 x 400 .92 Acres, 100 Frontage
- • Commercial Zoning
- • Property Taxes $10,000 -
Additional Photos
Listing Agents

Rick Recckio
O: 716-631-5555
M: 716-998-4422
rick@recckio.com
O: 716-631-5555
M: 716-998-4422
rick@recckio.com
While we strive to provide the most accurate information, all listing information, and demographic data, is provided by third-parties. As such, MyEListing will not be responsible for the accuracy of the information. It is strongly recommended that you verify all information with the listing agent, and any relevant agencies, prior to making any decisions.