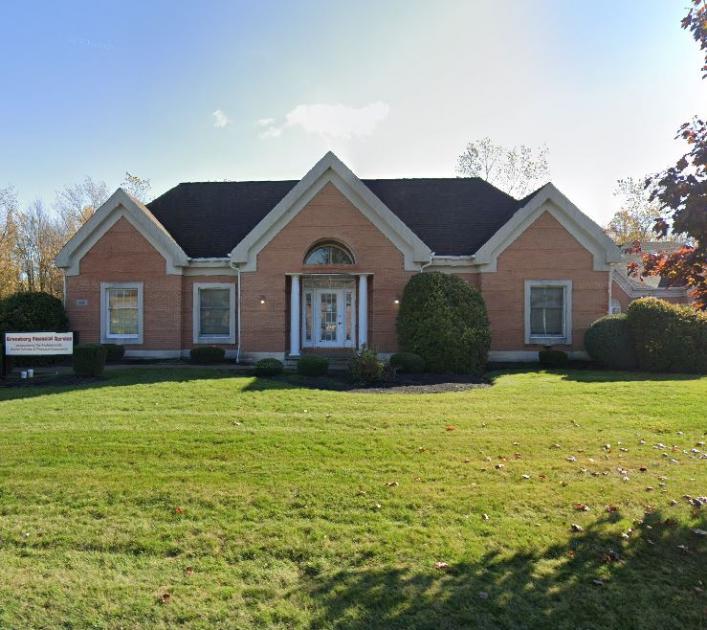
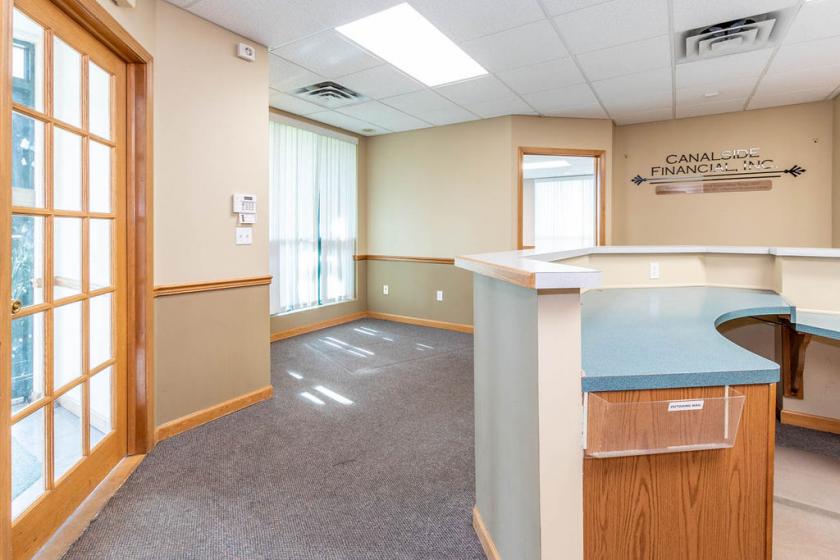
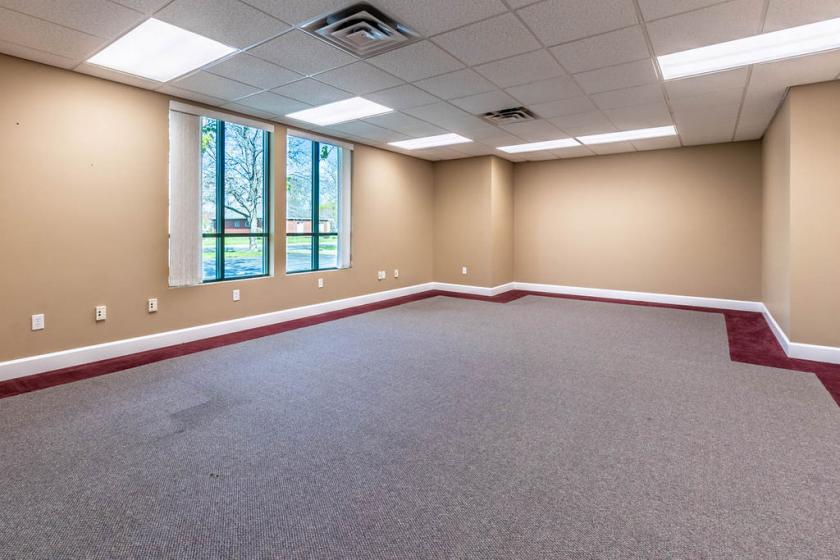
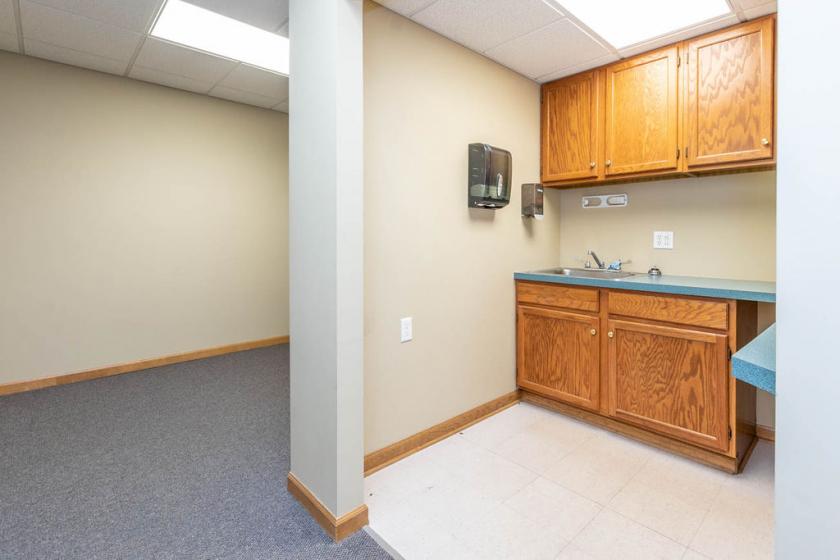
This Medical and Professional office park complex consist of nineteen (19) office buildings ranging in size from 2,400+/- SF up to 12,200+/- SF and most are set up for multiple tenants. Suite sizes are as small as 600+/- SF and are as large as 10,000+/- SF. Each building are all wood frame, brick exterior, single story professional office buildings with crawl spaces or full basements and asphalt shingle roofs. Some of the entrances are shared by multiple tenants within each building. Each building can be leased or sold separately since each building is situated on its own tax parcel. The lots range from 0.35+/- acres up to 1.19+/- acres. Currently the complex is approximately 50% occupied with medical and office professional tenants. These buildings are ideal for any medical, attorney, accountants, office owner, or professional uses. The complex has multiple points of access in or out of the park as well as ample parking situated around each building for employee and client parking. This Medical & Professional Office Park is situated just north of Lincoln Avenue on Davison Road in the City of Lockport, NY. 1.5 miles East of Transit Road, one mile south of Lockport Memorial Hospital. Easy access to the Downtown Lockport area and all the national retail stores, restaurants, and Hotels such as Walmart Supercenter, Runnings, Tops Supermarket, Starbucks, Tim Horton, Denny's, Burger King, Home Depot, Big Lots, Hampton Inn Lockport, Wendy's, Lockport Outdoor Store, Tractor Supply Company, Panera Bread, Office Depot, Applebee's, Aldi, Holiday Inn Express, Family Dollar, PetSmart, Advance Auto Parts, Dollar General, and many others. Lockport is located in the center of Niagara County approximately 18 miles east of the Niagara Falls USA / Canadian border and 30 miles from Downtown Buffalo.