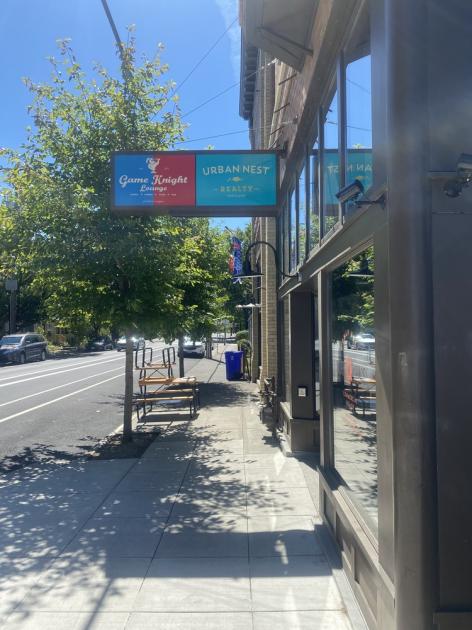
1-Mile | 3-Miles | 5-Miles | ||
---|---|---|---|---|
Total Population | 24,552 | 204,358 | 391,493 | |
Population Median Age | 38 | 39 | 39 | |
Population by Age | 0-9 Yrs | 1742 (7%) | 15858 (7%) | 34684 (8%) |
10-19 Yrs | 1644 (6%) | 14584 (7%) | 32452 (8%) | |
20-29 Yrs | 4897 (19%) | 38525 (18%) | 66986 (17%) | |
30-39 Yrs | 6088 (24%) | 45073 (22%) | 82242 (21%) | |
40-49 Yrs | 3847 (15%) | 31171 (15%) | 59609 (15%) | |
50-59 Yrs | 2746 (11%) | 22580 (11%) | 44325 (11%) | |
60-69 Yrs | 2217 (9%) | 22102 (10%) | 41148 (10%) | |
70+ Yrs | 1371 (5%) | 14465 (7%) | 30046 (7%) | |
Median HH Income | $79,899 | $72,916 | $75,773 | |
Total Household Income | < 24K | 2011 (17%) | 20109 (20%) | 31070 (17%) |
25-49K | 1759 (15%) | 16158 (16%) | 29355 (16%) | |
50-74K | 1711 (14%) | 14419 (14%) | 27139 (15%) | |
75-99K | 1251 (10%) | 11156 (11%) | 21627 (12%) | |
100-199K | 3244 (28%) | 25467 (25%) | 46832 (26%) | |
200K+ | 1476 (12%) | 11789 (11%) | 20444 (11%) | |
Highest Education Level | No Diploma | 841 | 5799 | 13520 |
Diploma or GED | 2035 | 16235 | 33698 | |
Some College | 3076 | 28985 | 56378 | |
Assoc. Degree | 1131 | 8534 | 17578 | |
Bachelors Degree | 7251 | 60550 | 104405 | |
Higher Degree | 5220 | 41380 | 74435 | |
Total Housing Units | 12,398 | 107,542 | 190,091 | |
--Owner-Occupied | 4,608 | 41,204 | 86,491 | |
--Renter-Occupied | 6,845 | 57,894 | 89,976 | |
Owner-Occupied Values | < 100K | 70 | 515 | 1434 |
100-199K | 24 | 647 | 2517 | |
200-299K | 220 | 3105 | 8674 | |
300-399K | 590 | 6558 | 16706 | |
400-499K | 951 | 8392 | 17775 | |
500K+ | 2754 | 21986 | 39385 | |
Total Working Age Population | 21,745 | 179,922 | 338,555 | |
In Work Force | 16,850 | 131,576 | 243,930 | |
Not In Work Force | 4,894 | 48,346 | 94,625 | |
Workforce Employed | 16,155 | 125,981 | 233,315 | |
Workforce Unemployed | 676 | 5,529 | 10,506 | |
Civlian Workforce | 16,831 | 131,510 | 243,821 | |
Military Workforce | 19 | 66 | 110 | |
Total Households | 11,453 | 99,098 | 176,467 | |
Family Households | 4,486 | 38,121 | 78,734 | |
Non-Family Households | 6,967 | 60,976 | 97,734 | |
Married Couple | 3,475 | 30,704 | 61,937 | |
Other Family | 1,011 | 7,417 | 16,797 | |
Married w/Child | 1,283 | 11,273 | 23,748 | |
Single Male w/Child | 94 | 1,018 | 2,467 | |
Single Female w/Child | 403 | 3,054 | 6,003 |
Population Change Last Two Decades - Plus Projection
2000 | % | 2010 | % | 2020 | % | 2030 | |
---|---|---|---|---|---|---|---|
Oregon | 3,421,399 | +12 | 3,831,074 | +11 | 4,264,810 | +11 | 4,727,438 |
Multnomah County | 660,486 | +11 | 735,334 | +12 | 822,675 | +10 | 906,904 |
Washington County | 445,342 | +19 | 529,710 | +17 | 619,337 | +16 | 718,633 |
Washington | 5,894,121 | +14 | 6,724,540 | +14 | 7,638,415 | +11 | 8,503,178 |
Clark County | 345,238 | +23 | 425,363 | +17 | 499,400 | +16 | 576,879 |
Total Working Age Population:
Total Households:
Total Working Age Population:
Total Households:
Total Working Age Population:
Total Households: