Retail Space
335 West 9th Street Indianapolis, IN 46202
335 West 9th Street Indianapolis, IN 46202
Details & Description
Property Highlights
• More than 150,000 daytime population drawing from the CBD and IUPUI trade area
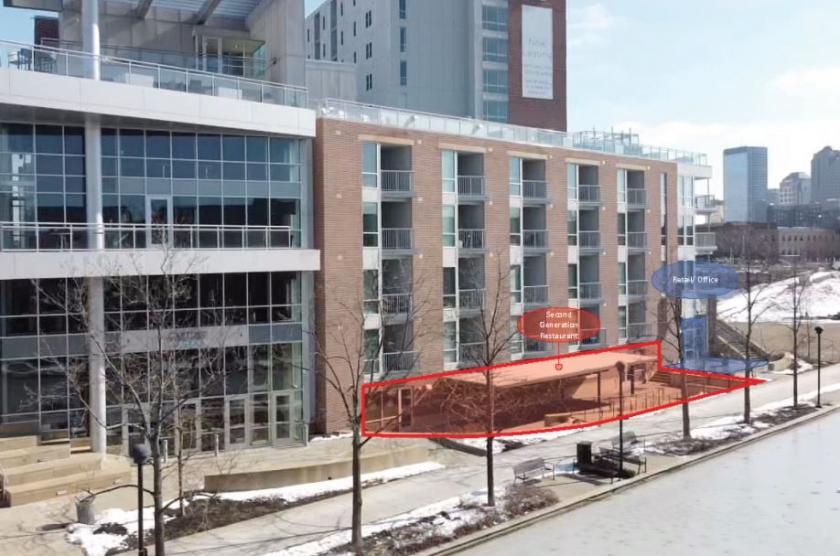
• Second generation plug n play restaurant space with outdoor dining terrace
Listing Agents

Lora Moore
O: 317-853-7500
lora@alopg.com
O: 317-853-7500
lora@alopg.com
While we strive to provide the most accurate information, all listing information, and demographic data, is provided by third-parties. As such, MyEListing will not be responsible for the accuracy of the information. It is strongly recommended that you verify all information with the listing agent, and any relevant agencies, prior to making any decisions.