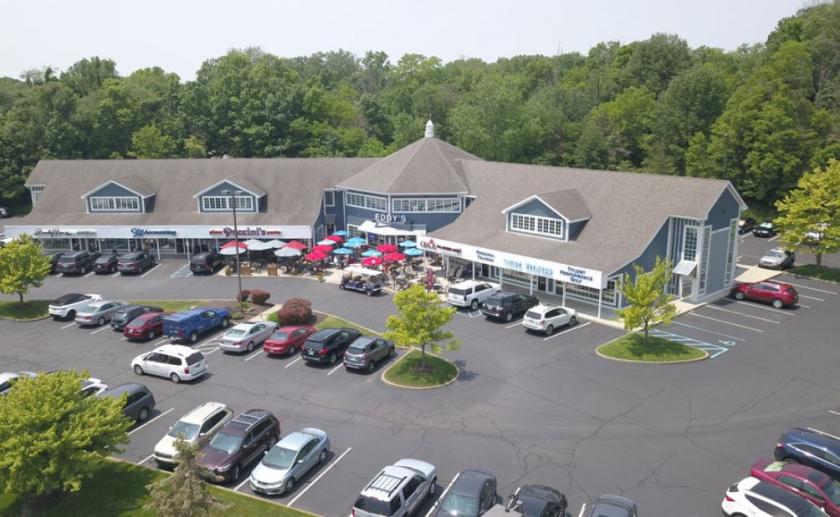
Office Space
11691 Fall Creek Road Indianapolis, IN 46256
11691 Fall Creek Road Indianapolis, IN 46256
Details & Description
Property Highlights
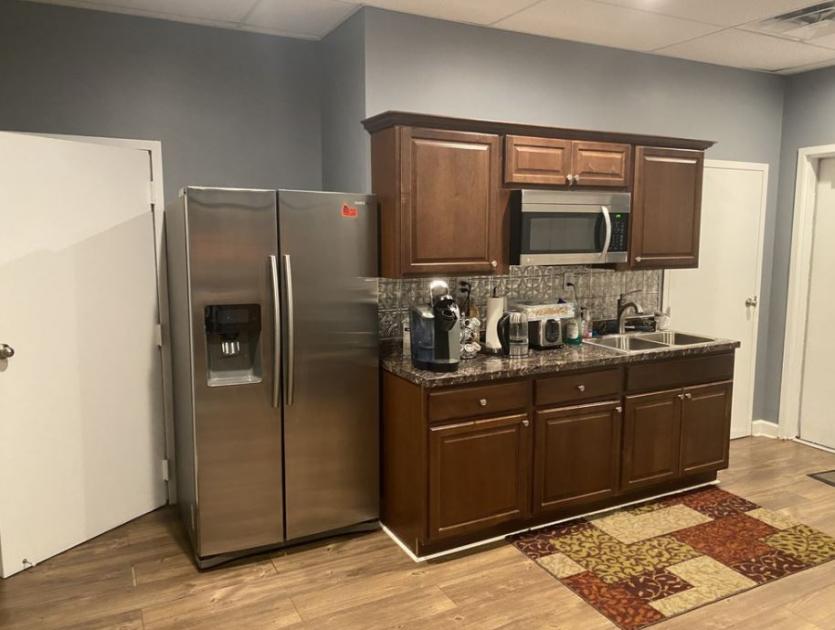
• Q4 Availability- 5 private oces, kitchenette, conference room, restroom and small reception.
• Excellent Location - 1,800 SF of 1st oor oce space overlooking Geist Marina.
Additional Photos


Listing Agents

Mike Short
O: 317-853-7502
mike@alopg.com
O: 317-853-7502
mike@alopg.com
While we strive to provide the most accurate information, all listing information, and demographic data, is provided by third-parties. As such, MyEListing will not be responsible for the accuracy of the information. It is strongly recommended that you verify all information with the listing agent, and any relevant agencies, prior to making any decisions.


